In today's digital platforms, search is often the primary way users discover products, courses, content, services, and information.
Customers expect search results to be fast, relevant, and up to date.
For one of our clients, PostgreSQL served as the system of record for business transactions, while OpenSearch powered the search experience. The challenge was ensuring that changes made in PostgreSQL were reflected in OpenSearch quickly and reliably without impacting application performance.
To address this, we implemented a real-time synchronization architecture using Kafka Connect while complementing it with monitoring and reconciliation capabilities to ensure business confidence in the data.
The Business Challenge
The client's platform relied heavily on search.
Users were constantly:
- Searching products
- Filtering catalogs
- Discovering content
- Exploring offerings
While PostgreSQL remained the authoritative source of business data, OpenSearch provided the fast and flexible search experience users expected.
The challenge was straightforward:
How do we keep OpenSearch synchronized with PostgreSQL as data changes throughout the day?
Without a reliable answer, teams face a costly reality:
- Customers report broken search results at 2am → emergency incident → lost revenue
- Operational team spends 4+ hours debugging "Is the lag in Kafka? Debezium? OpenSearch?"
- Data audits reveal inconsistencies → compliance risk → board escalation
- Teams lose confidence in the search platform → fallback to slower, less user-friendly filters
The solution needed to support:
- Near real-time updates
- Scalability as data volumes grow
- Minimal impact on transactional systems
- Operational visibility and reliability
Why Kafka Connect
Rather than building and maintaining custom synchronization services, we leveraged Kafka Connect as the foundation of the integration layer.
The architecture looked like this:
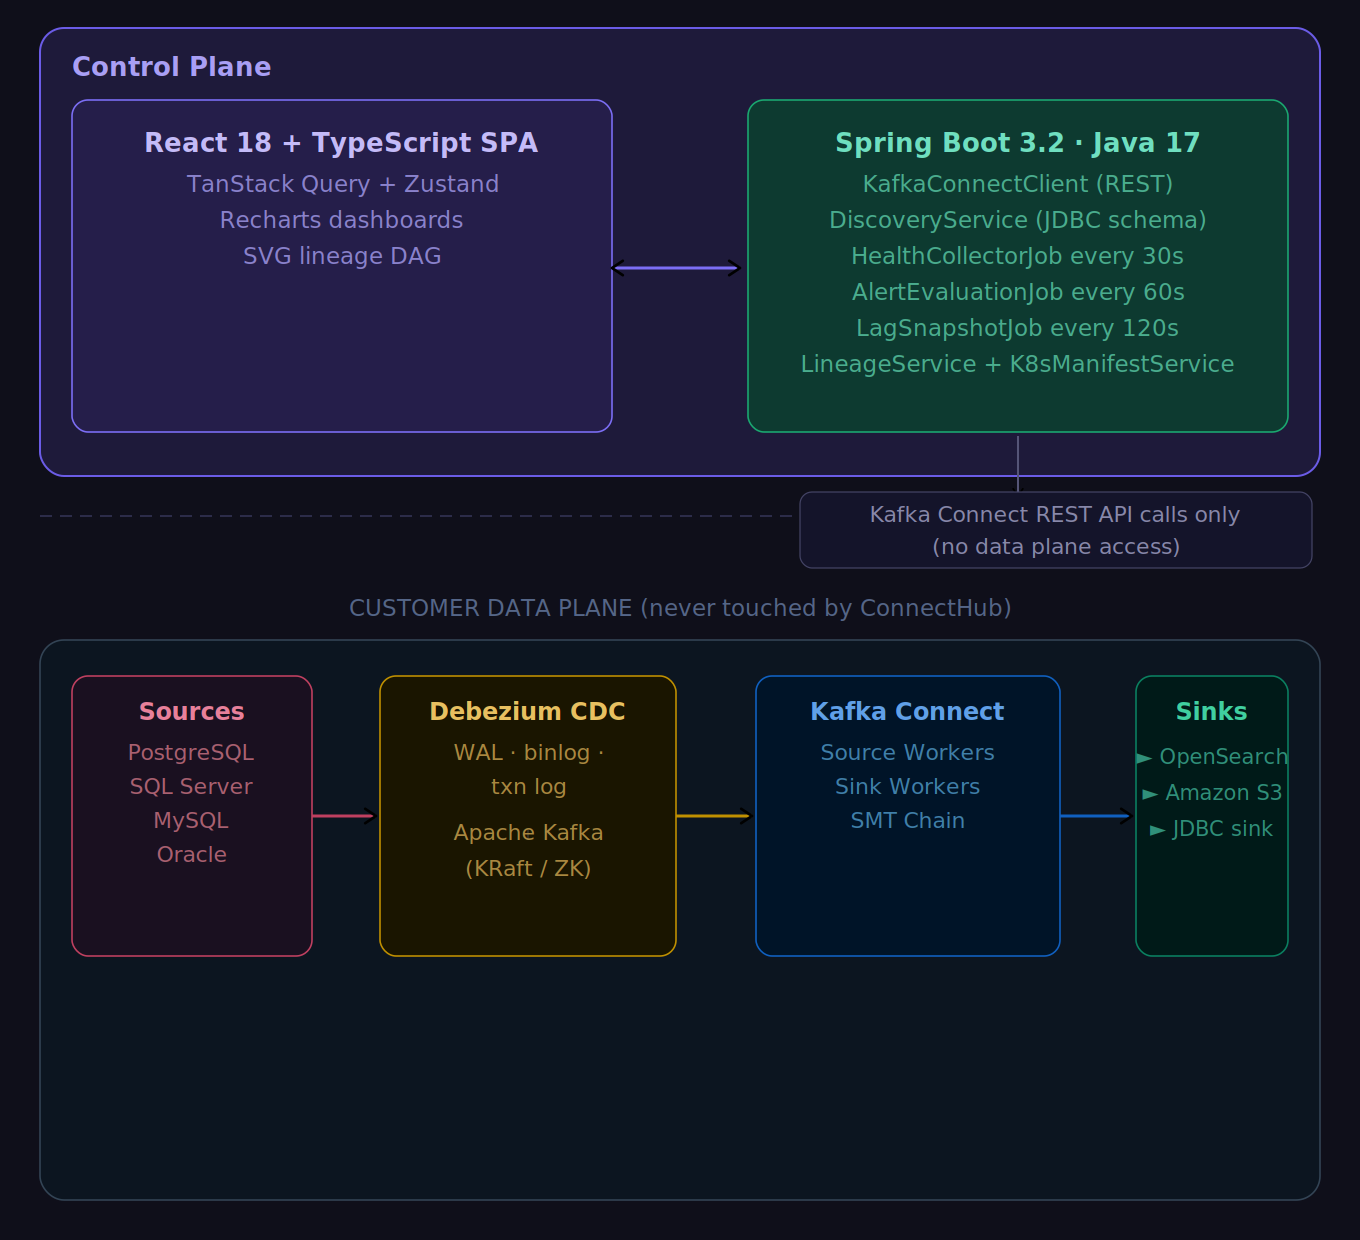
Real-time data synchronization architecture
This approach provided several advantages:
- Reduced custom development effort
- Scalable and distributed processing
- Built-in fault tolerance
- Simplified operational management
- Faster delivery timelines
By using Kafka Connect, the team could focus on business outcomes rather than building and maintaining data movement infrastructure.
Beyond Data Movement
While moving data from PostgreSQL to OpenSearch was important, the real business requirement was trust.
Business users did not ask:
Is Kafka Connect running?
They asked:
Can we trust the search results?
A synchronization pipeline can appear healthy from an infrastructure perspective while still leaving stakeholders concerned about data consistency.
For this reason, we complemented the integration with a reconciliation framework.
The Importance of Reconciliation
As with any distributed system, occasional discrepancies can occur due to downstream outages, deployment issues, schema changes, or operational incidents.
Rather than assuming synchronization would always be perfect, we designed for verification and recovery through continuous data validation.
Our reconciliation framework performed periodic batch comparisons between PostgreSQL (source) and OpenSearch (destination) across key metrics:
- Record count validation — Compare total records in PostgreSQL against indexed documents in OpenSearch
- Data hash verification — Hash source records and compare against hashed destination data to detect content changes
- Mismatched record detection — Identify specific records that exist in source but are missing or differ in destination
- Synchronization lag measurement — Track time delta between source transaction and destination indexing
- Data consistency score — Calculate percentage of matched records: (matched records / total source records) × 100
When mismatches were detected, the system automatically triggered recovery workflows:
- Identify the affected record IDs and partitions
- Re-emit events through Kafka for those specific records
- Apply reconciliation-specific transformations if schema changes occurred
- Validate the fix with a follow-up comparison
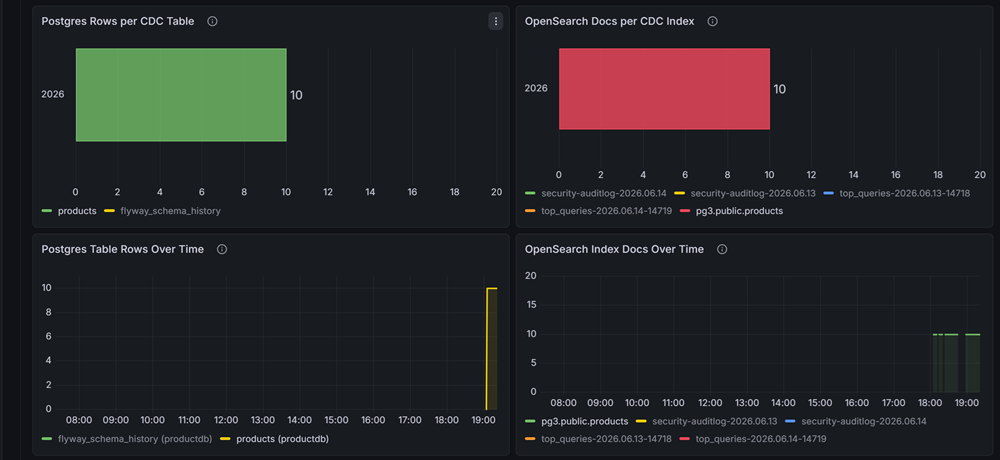
Reconciliation dashboard: Source vs. Destination validation metrics
Most importantly, teams had a complete audit trail of what data had been validated and when, enabling them to identify and resolve issues proactively before end users were impacted.
Building Confidence Through Observability
The combination of Kafka Connect and reconciliation delivered two critical capabilities:
Real-Time Synchronization with SLA Tracking
Changes made in PostgreSQL were propagated through Kafka Connect to OpenSearch. We tracked:
- End-to-end latency — Time from source commit to destination index update (target: <5 seconds for 95th percentile)
- Connector health — Task failures, rebalancing events, and recovery time
- Throughput metrics — Records/second processed, batch sizes, and Kafka lag
- Error rates — Failed transformations, dead letter queue messages, and retry attempts
Continuous Data Validation & Mismatch Detection
Reconciliation jobs ran on a configurable schedule (hourly, daily, or on-demand) to validate data integrity:
- Record count comparison — PostgreSQL row count vs. OpenSearch document count
- Mismatched records report — Lists of IDs where data differed between source and destination
- Data quality score — Percentage of records in perfect sync (calculated per table and globally)
- Missing record detection — Records in PostgreSQL but not indexed in OpenSearch
- Stale data identification — Records with outdated timestamps or version mismatches
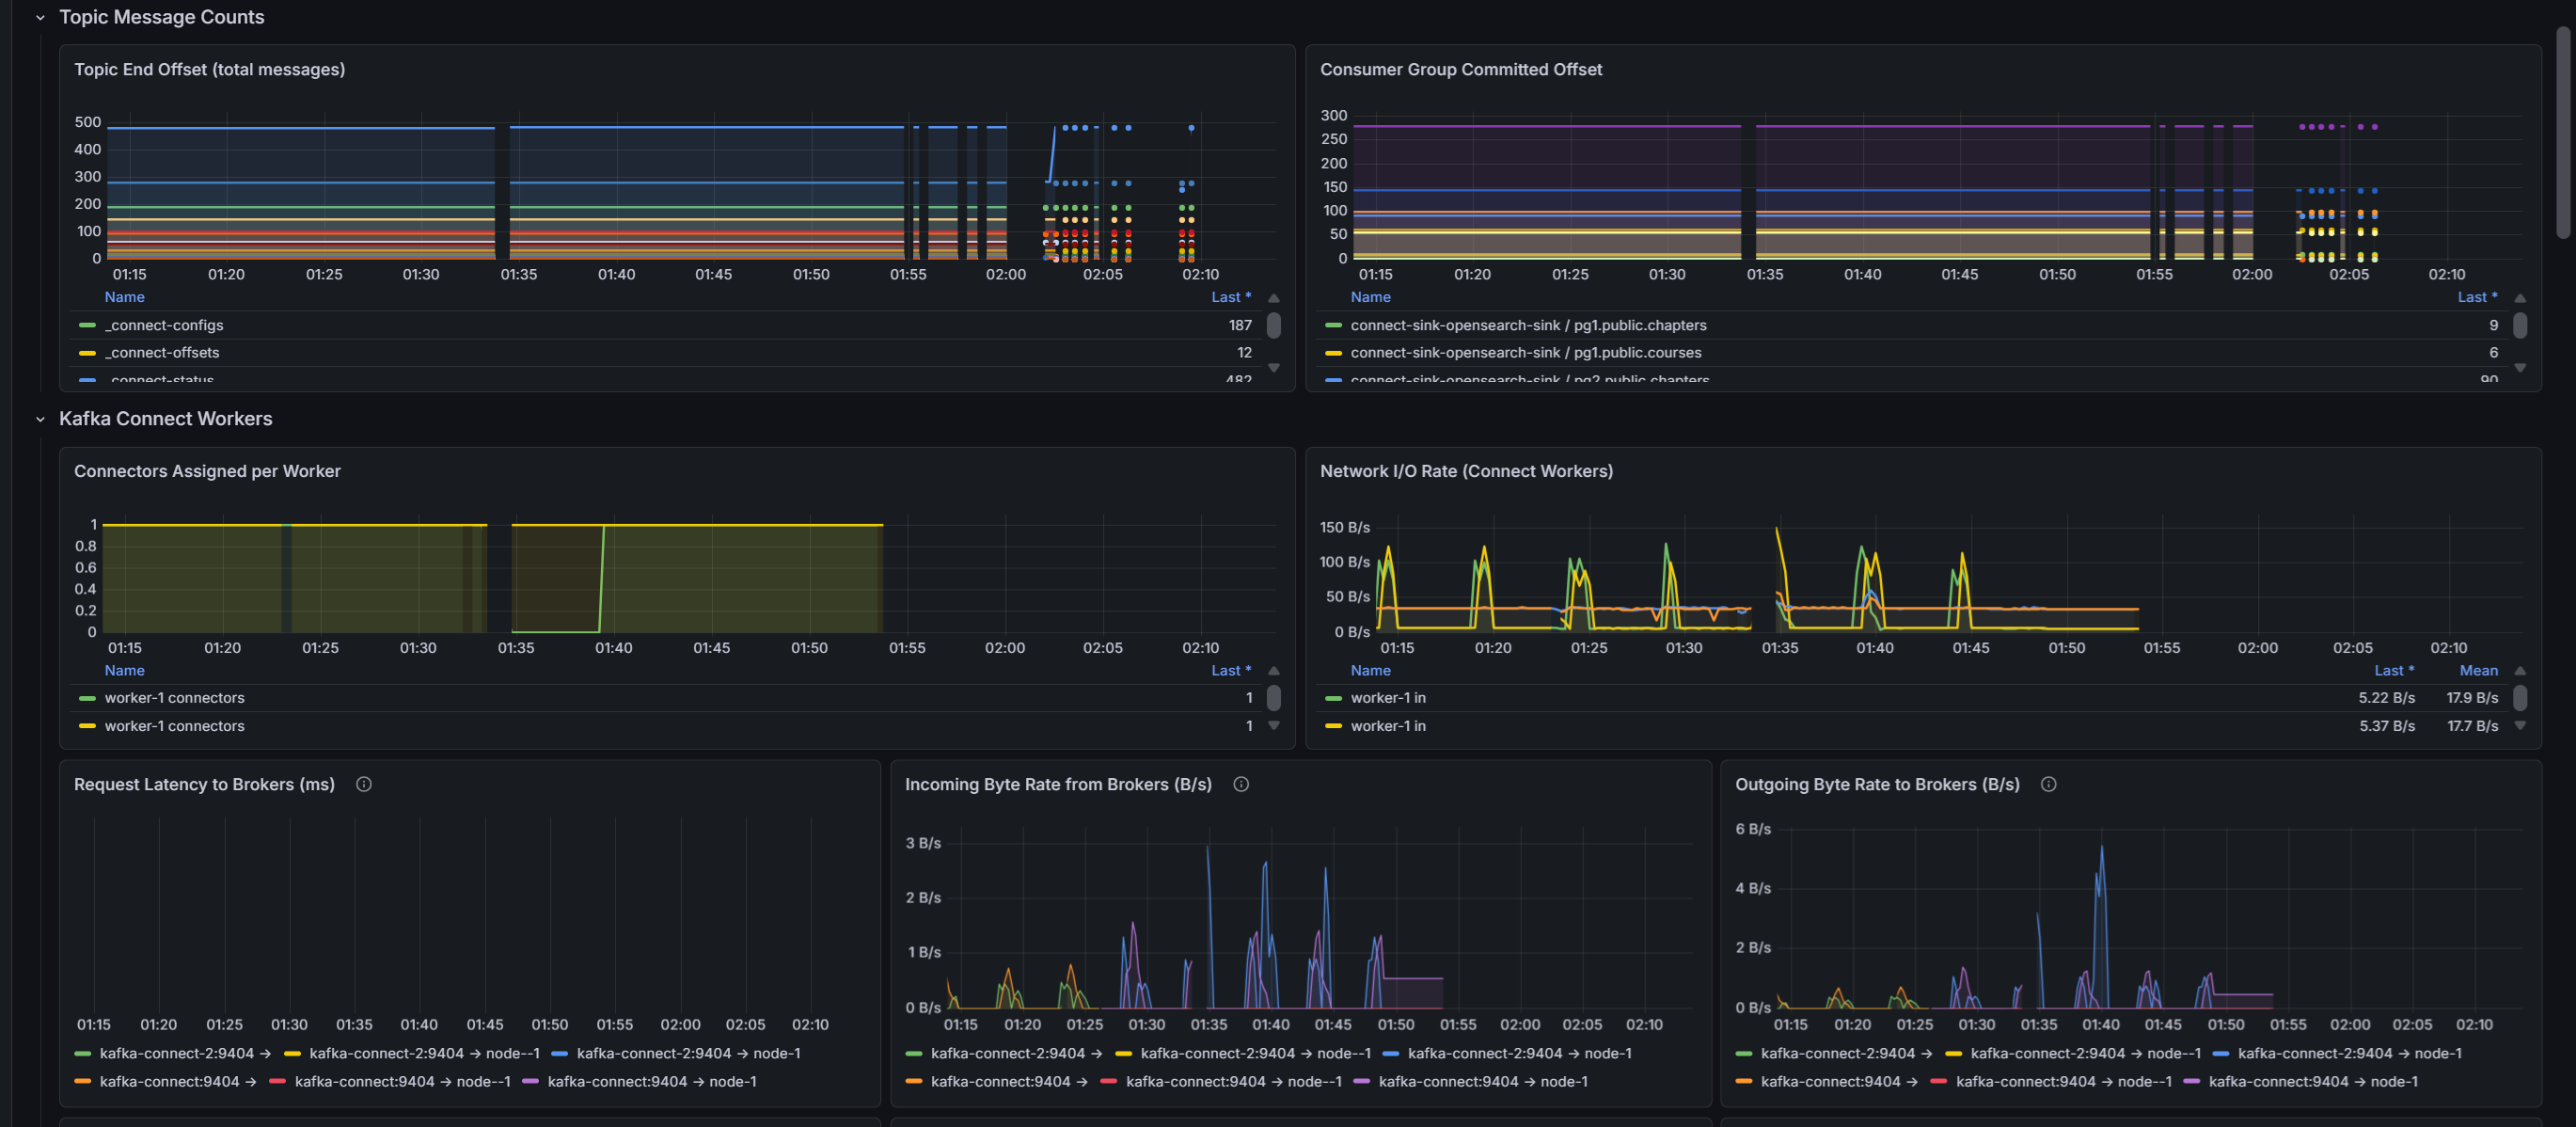
Real-time synchronization and data quality dashboard
This transformed synchronization from a "best effort" process into a measurable and observable business capability. Every stakeholder could see:
- Today's consistency score across all tables
- Which records (if any) were out of sync and why
- How long it takes for changes to reach the search index
- When the last successful validation occurred
For teams already operating Kafka Connect at scale: The following section dives into advanced observability patterns across the full CDC stack. If you're just getting started with synchronization, the core principles above (reconciliation + monitoring) are sufficient. But once you're managing multiple connectors in production, this is where the real operational maturity kicks in.
How We Reduced CDC Troubleshooting from Hours to Minutes with End-to-End Observability
Many teams assume their CDC pipeline is healthy because Kafka Connect reports RUNNING. Unfortunately, we've seen production environments where everything appeared healthy while replication lag continued growing, WAL files accumulated, and downstream systems consumed increasingly stale data.
The challenge wasn't CDC. The challenge was visibility.
The Problem
A typical CDC pipeline spans multiple systems:
- PostgreSQL
- Debezium
- Kafka Connect
- Kafka
- Downstream Consumers
When issues occur, teams often waste hours answering a simple question: Where is the bottleneck? Without proper observability, troubleshooting becomes guesswork:
- Is PostgreSQL generating changes too quickly?
- Is Debezium falling behind?
- Is Kafka overloaded?
- Are consumers unable to keep up?
Most monitoring solutions only answer part of the question.
Our Approach
Instead of monitoring individual components, we built observability across the entire CDC data flow, focusing on metrics that directly impact reliability and data freshness.
Database Visibility — We monitor replication slot lag, WAL generation rate, and disk usage. These metrics help identify CDC pressure before storage issues appear.
Kafka Connect Visibility — We monitor connector status, task status, queue size, batch size, and records per second. This allows us to quickly determine whether connectors are keeping pace with database activity.
Kafka Visibility — We monitor topic lag, produce rate, and consumer lag. This provides insight into downstream processing health and end-to-end latency.
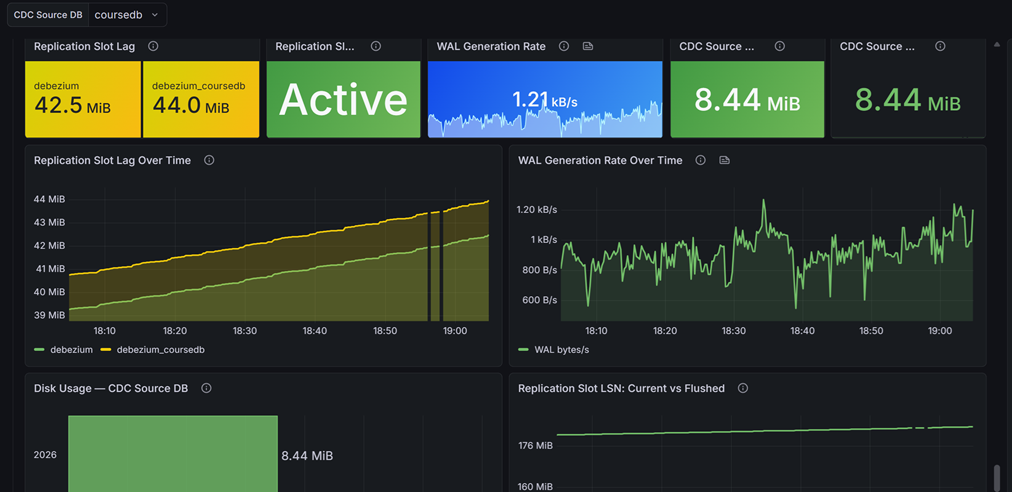
End-to-end CDC observability: database, Kafka Connect, and Kafka metrics in a single view
The Result
Instead of spending hours tracing issues across multiple systems, teams can immediately identify where delays originate. For example:
- When replication slot lag increases alongside queue growth, the issue is typically connector throughput.
- When Kafka remains healthy but consumer lag grows, the bottleneck exists downstream.
- When WAL generation spikes unexpectedly, teams can proactively scale before data freshness is impacted.
The result is faster incident response, improved reliability, and greater confidence operating CDC in production.
Why This Matters
Most CDC failures don't begin as outages. They begin as small signals:
- Growing lag
- Increasing queues
- Slower consumers
- Accumulating WAL files
Organizations that detect these signals early avoid the operational fire drills that come later.
Need Help Operating CDC at Scale?
We help organizations build and operate production-grade CDC platforms using PostgreSQL, Debezium, Kafka Connect, and Kafka. If you're experiencing replication lag, data freshness issues, or limited visibility into your CDC pipeline, let's talk.
Business Outcomes
The solution delivered several tangible benefits:
- Faster and more responsive search experiences
- Reduced operational overhead
- Improved platform scalability
- Greater confidence in search accuracy
- Faster identification and resolution of synchronization issues
What this looks like in practice:
- Troubleshooting time: Dropped from "4+ hours of blind debugging" to "identify bottleneck in 15 minutes"
- Incident frequency: Replication lag incidents go from "weekly fire drills" to "proactive detection before impact"
- Stakeholder confidence: Ops and product teams go from "do we trust the search index?" to "yes, we have proof"
- Deployment velocity: Schema changes and connector updates go from "scary, manual" to "routine with confidence"
Most importantly, teams transition from reactive firefighting (responding to customer-reported issues) to proactive monitoring (catching problems before users feel them). That shift is where real reliability lives.
Building This for Your System
If you're facing similar challenges with data synchronization between transactional systems and search platforms, we can help you design and implement a comparable solution tailored to your architecture.
Our approach includes:
- Custom reconciliation frameworks — Built in Python, Go, or Java to match your existing stack
- Metrics pipeline design — Integration with Prometheus, Grafana, or your monitoring system
- Recovery automation — Intelligent replay and re-indexing for detected mismatches
- Data quality dashboards — Real-time visibility into consistency scores and mismatched records
- SLA definition and tracking — Setting and monitoring synchronization latency targets
- Operational runbooks — Clear procedures for investigating and resolving data discrepancies
Start Smaller
You don't need to implement everything at once. We help teams start with basic reconciliation (record counts and hashes) and evolve toward comprehensive data quality frameworks as your needs grow.
Key Takeaway
Kafka Connect proved to be an effective foundation for moving data between PostgreSQL and OpenSearch. However, the real success of the solution came from pairing data movement with reconciliation and observability.
In our experience, reliable search platforms are not built solely by synchronizing data. They are built by ensuring that synchronization can be monitored, validated, and trusted over time.
That combination of automation, visibility, and recoverability is what ultimately enables organizations to deliver high-quality digital experiences at scale.
Key Takeaway
Reliable search platforms require more than just moving data. They demand observability, reconciliation, and continuous validation to maintain stakeholder confidence and ensure business outcomes at scale.
Is your CDC pipeline struggling with visibility or data confidence? We design and build these architectures as custom engagements.