Case Study · AI Engineering · Retail Analytics

A dashboard that reasons, not just displays, and knows when to say no

Most "AI dashboards" are a natural-language search bar sitting on top of charts someone already built. We built something different for a retail analytics platform: a live reasoning layer that composes new answers on real data, cites every number it states against the actual query result, and refuses honestly the moment the data can't back up a claim, instead of guessing.

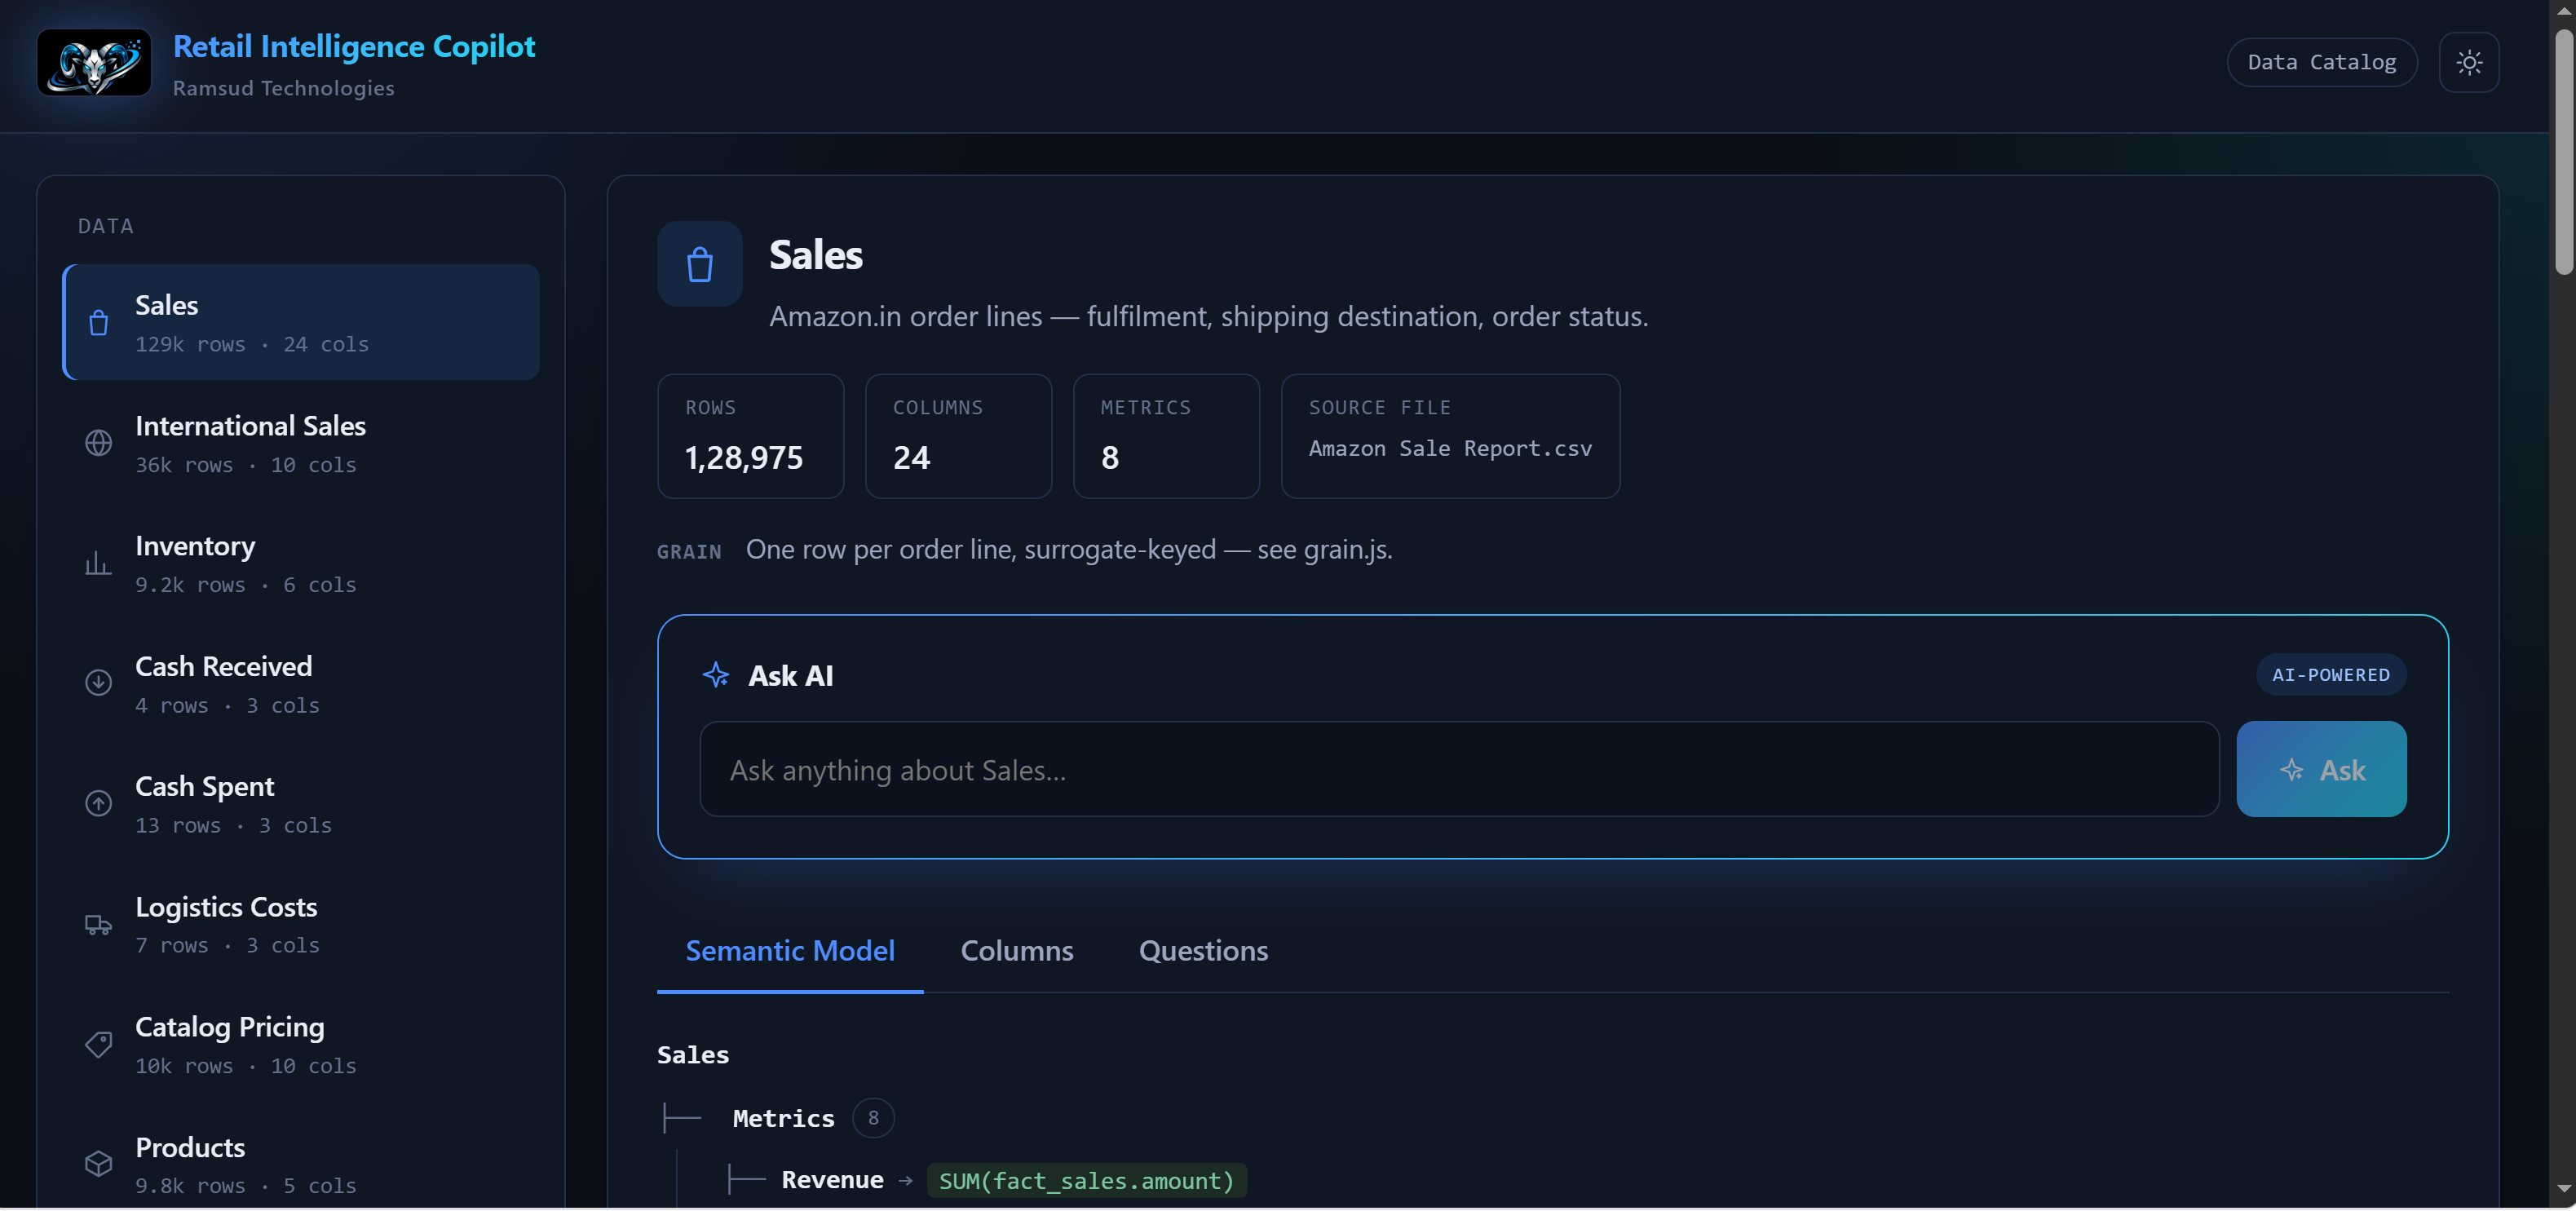
Retail Intelligence Copilot dashboard, semantic model tree, live metric definitions, and an AI-answered question with a verified citation

An "AI-powered" dashboard should mean the model can reason about your data, not that a chat box was bolted onto the same static charts.

0
Fabricated Numbers
Every stated number is checked against the literal query result before it ships. A mismatch withholds the sentence rather than guessing through it
9,235
SKUs Reasoned Over Live
Evidence-gated restock/promote/stop recommendations across the full catalog, not a cached sample
8-Stage
Validation Pipeline
Schema → Availability → Plan → Graph → Complexity → AST → Cost → Exec, before a single query touches production data
$0
Cost for Routine Questions
Daily numbers run a deterministic, zero-AI path; the model is spent only on what a fixed report structurally can't answer

The old way is still one click away because nothing is hidden behind the answer

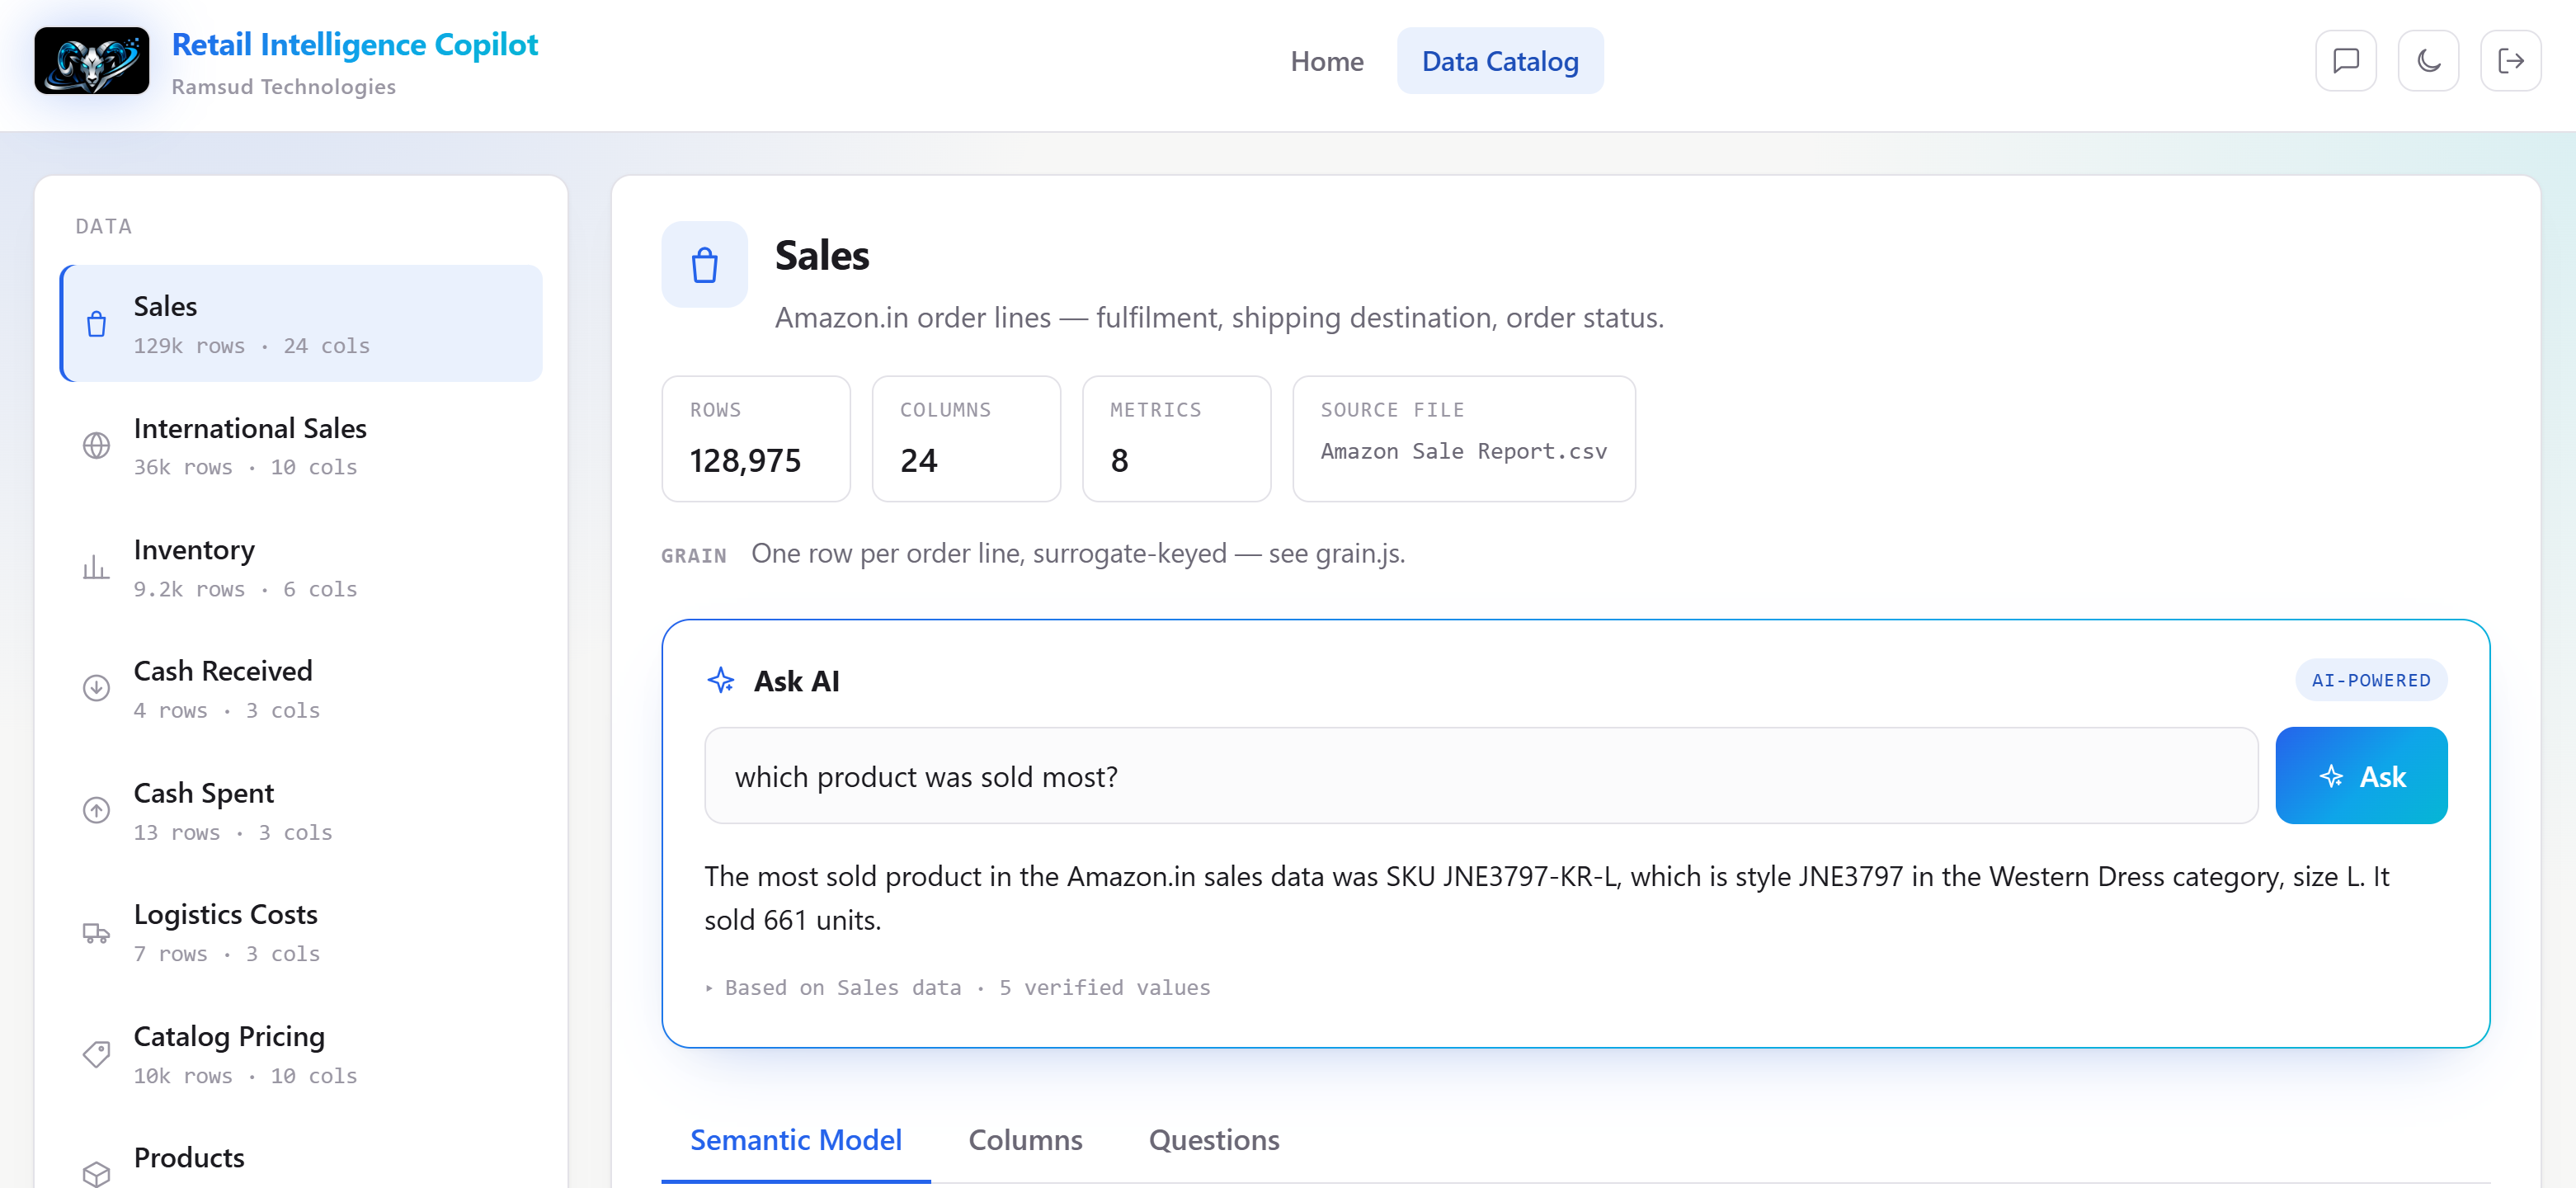
This is one real screenshot, not two mockups stitched together. Left, the manual path: open the catalog, find the right table among nine, read that it has 24 columns and a stated grain, then work out the query yourself. Right, same screen: type the question in plain English and get a cited answer in seconds, with the exact number of verified values it drew from disclosed underneath.

Data Catalog screen showing the manual table-browsing sidebar on the left (Sales, International Sales, Inventory, and other raw tables with row and column counts) next to the Ask AI panel on the right answering 'which product was sold most?' with a citation of 5 verified values
Same screen, same session: the raw catalog on the left is what "no AI" looks like: nine tables, row counts, column counts, grain notes, and no answer until someone writes the query. The Ask AI panel on the right is the same table, one typed question, and a cited answer in seconds.

Four things a fixed dashboard cannot do, explained without the jargon

You don't need to know what a "semantic layer" is to see the difference. Here are four real situations, captured directly from this system while it was running, not mockups, not hypotheticals, each with the everyday version first and the proof underneath.

"Which of these 400 low-stock items do I actually reorder today?"

A normal dashboard shows you a table: 400 products below reorder threshold, sorted by whatever column you clicked. It's still on you to scroll through and decide which ones actually matter. This system has already done that thinking for every single product. It tells you, in a plain sentence: reorder this one, it sold 40 units this week and has two weeks of stock left; skip that one, it's been sitting untouched for three months. What this means for your business: your team stops spending an afternoon a week in a spreadsheet deciding what to reorder, and starts acting on the answer the same day.

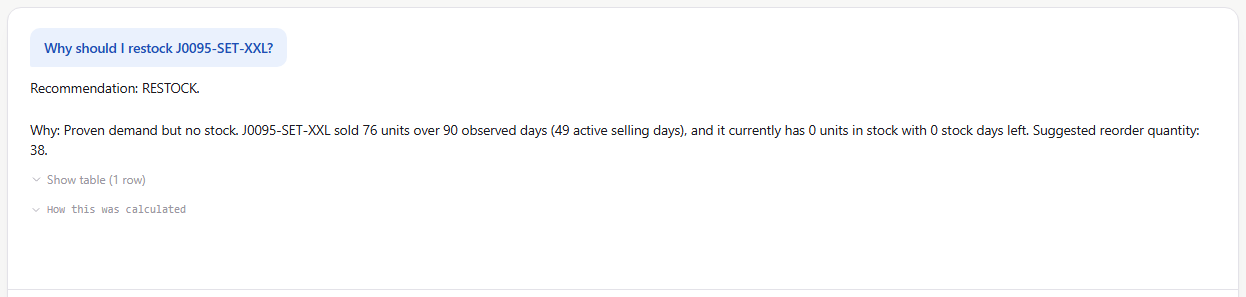
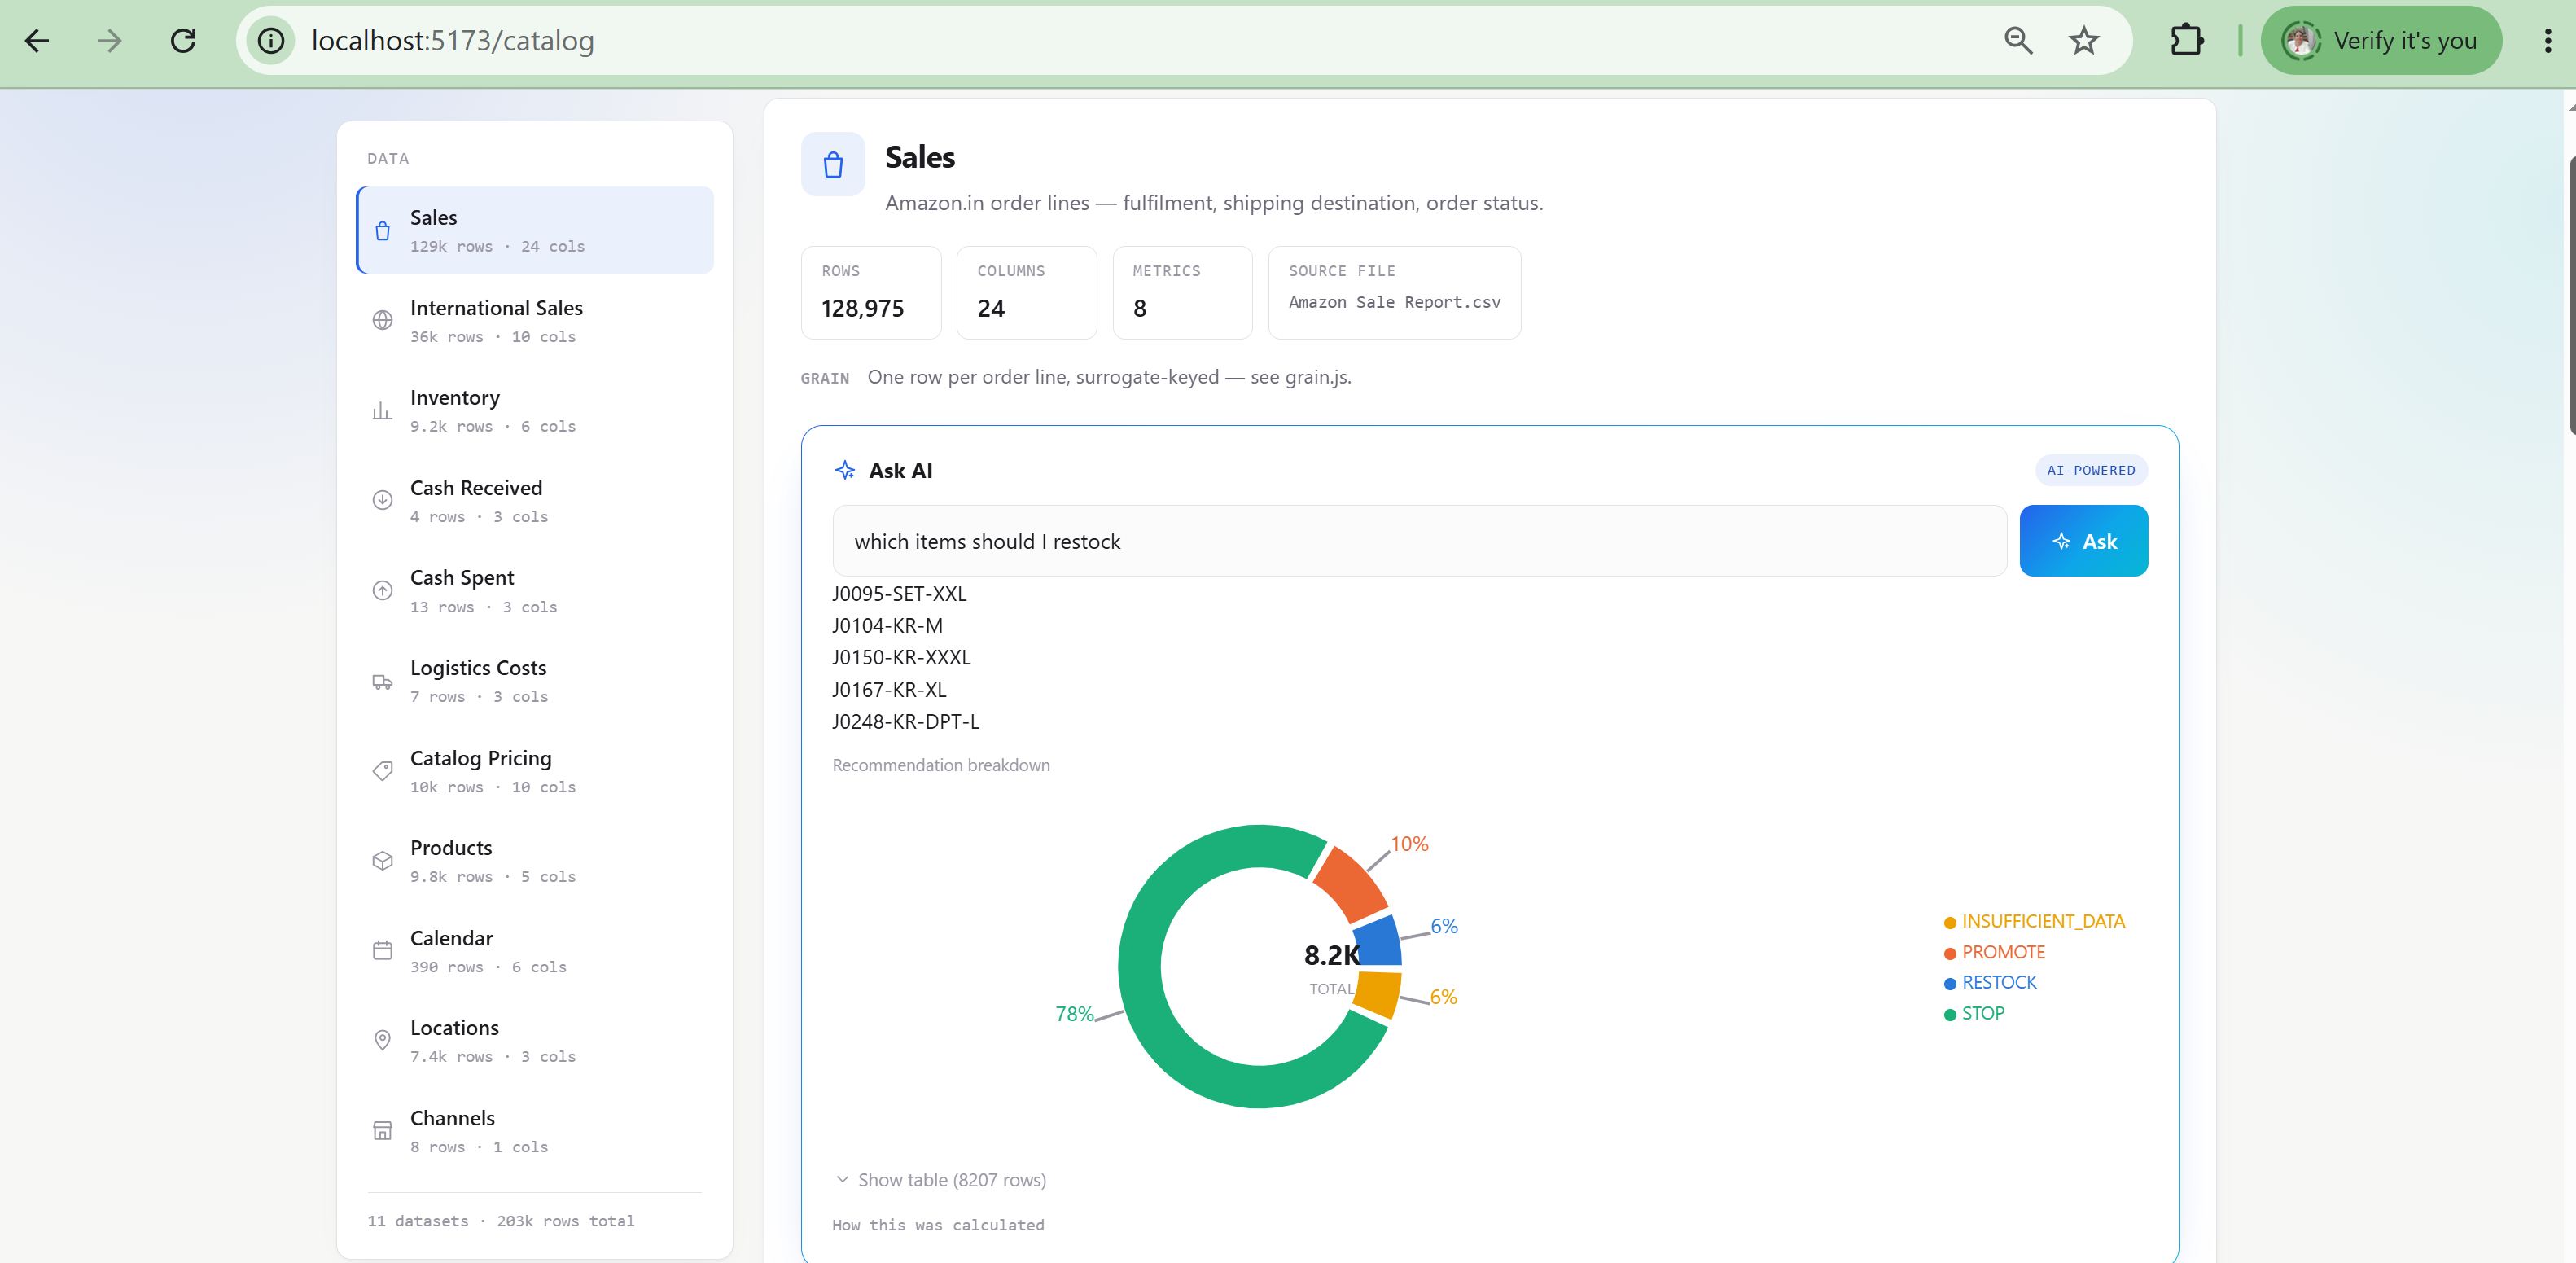
AI answer explaining why a specific product should be restocked, with the reasoning backed by real sales and stock numbers
A real click on a real "Restock" recommendation, captured live, not a mockup of what the answer might look like.

A question no report was ever built for: "How does shipping cost compare across product categories?"

Every dashboard you've ever used only answers the questions someone anticipated when they built it. The moment you ask something new, connecting two things nobody thought to link together in advance, a normal dashboard has nothing to show you. Someone has to file a request with IT or an analyst and wait days, sometimes weeks, for a new report. This system answers that same new question in seconds, safely, without a developer writing a line of code. What this means for your business: you stop waiting in a queue for every new business question, and start getting an answer the moment you think to ask it.

When the data to answer it honestly isn't there: "What was our profit last month?"

Ask most AI chat tools a question they can't really answer, and many will still hand you something, a number that looks perfectly normal on screen. You'd have no way to know it was made up unless you happened to double-check it yourself. Ask this system the same kind of question when the underlying cost data simply isn't loaded, and it tells you plainly that it can't calculate that, and why, instead of quietly inventing a number that looks fine until someone has already acted on it. What this means for your business: a wrong number never quietly slips into a decision, because the system tells you the moment it isn't sure, every time, regardless of how the question is worded.

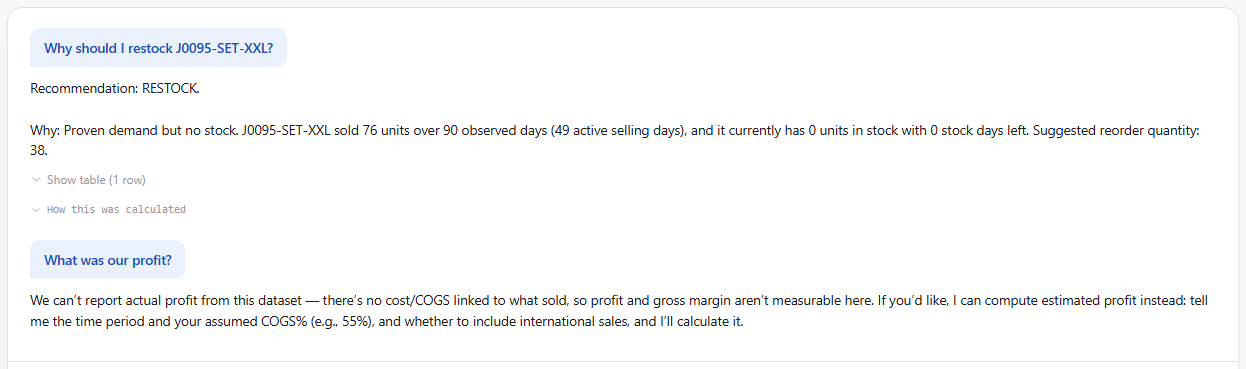
AI honestly declining to answer a profit question because cost data isn't available, explaining why and offering what it can answer instead
A real question, a real refusal, captured live: explained, not deflected, with what the system can answer offered in its place.

The same question every single day: "What were sales by category this month?"

Not every question needs a language model to answer it. "Sales by category this month" is the same question every single day. Having a model reason through it fresh each time is slower and costs real money for no real benefit. This system recognizes routine, repeatable questions like that and answers them instantly through simple point-and-click buttons, at zero AI cost, saving the actual reasoning for the handful of questions that genuinely need it (see the Quick Report builder in the product walkthrough below). What this means for your business: your everyday dashboard numbers stay instant and free forever. You only ever pay for AI on the questions that truly require thinking, not on the ones a button could answer just as well.

None of these four are about the model being clever. They're about the system doing something a static set of charts cannot do by construction, and knowing exactly when not to bother, and when to stop cleanly and say so.
Most "AI dashboards" are a search bar wearing a chatbot's face

Dashboards show numbers. They don't answer questions. Someone still has to know which filter to click, and when the answer genuinely isn't there, nothing tells you that. Bolting a chat box onto the same pre-built charts doesn't fix this; it just makes the dead end conversational.

Dashboards show numbers, not answers

A chart can look right and still be measuring the wrong thing: the wrong date range, a silently dropped join, cancelled orders counted in when they shouldn't be. Nothing on the screen tells you which.

"AI" stops at pre-built charts

Most natural-language BI features answer by matching your question to a chart or topic someone already indexed. Ask something nobody anticipated and it has nowhere to go.

Nothing catches a wrong number

A model that narrates over your data can state a number that sounds right and isn't. Without a verification step, confidence and correctness are the same thing to the reader, until they aren't.

Every question needs a data analyst

Knowing which metric, which filter, which join to use is schema knowledge most business users don't have and shouldn't need, just to ask what changed last month.

A reasoning layer built on a declared semantic model, never a chatbot writing SQL

The model never touches raw SQL and never sees the database. It picks from a closed, reviewed vocabulary of metrics, dimensions, and filters, declared once, in code, and every plan it builds is validated at eight separate stages before a single query executes. The result is checked against what actually ran before it's allowed to speak.

We don't let the model improvise SQL, and we don't let it state a number it can't prove. Those two rules are the entire trust model: everything else in the architecture exists to enforce them without slowing the product down.

Declare meaning once

What "revenue" means, which joins are safe, and what the data genuinely can't answer (and why) are declared in one semantic layer, read by the agent, the report builder, and every dashboard card alike, so none of them can drift apart.

Bound what the model can do

The model only ever emits a typed, strictly-validated query plan, never free text SQL. A dedicated compiler is the one and only thing that ever generates SQL, so the attack surface for a bad query is a small, reviewed piece of code, not a language model.

Verify before it speaks

The model's final answer must cite the exact row and column each number came from. A deterministic check confirms every citation against the real result set: a mismatch withholds the sentence and shows the raw data instead.

Every answer can show its own typed plan, on demand

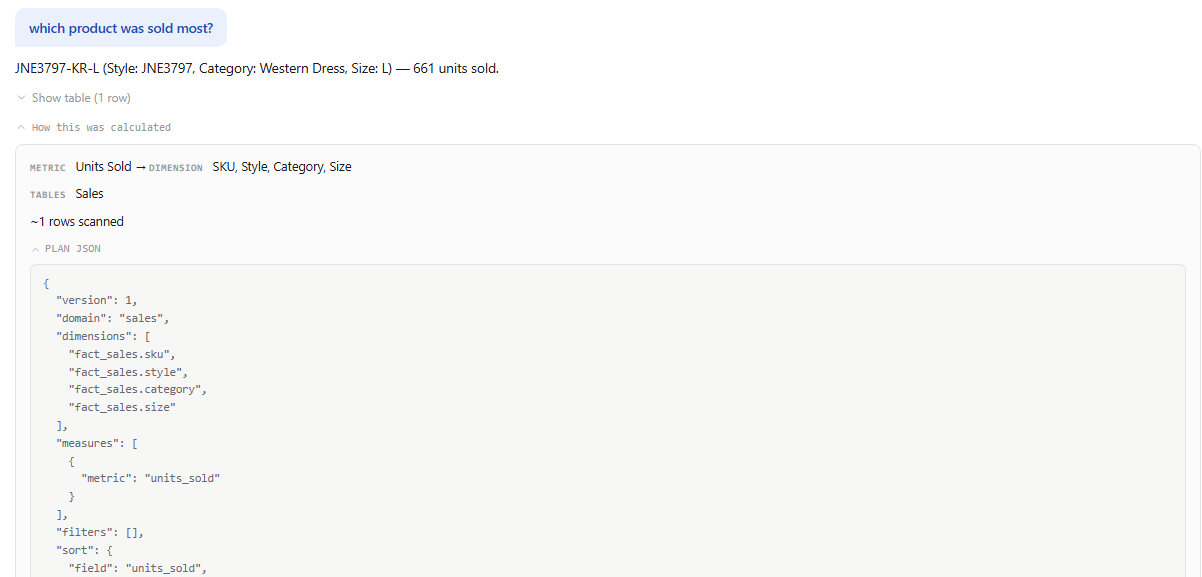
"Bound what the model can do" isn't a claim you have to take on faith. Every answer has a "How this was calculated" panel that expands into the exact typed query plan the model produced, the real tables and columns it touched, and the row count it scanned, the same object the compiler and validator actually ran against, not a simplified explanation written after the fact.

Expanded 'How this was calculated' panel showing the real typed query plan JSON behind a live answer: domain, dimensions, measures, filters, and sort, exactly as the compiler received it
A real answer with its "How this was calculated" panel expanded: the metric and dimension chain, the tables touched, rows scanned, and the exact typed Plan JSON the compiler validated before any SQL ran. Nothing here is written for display; it's the same object the pipeline itself used.

One safety boundary, three doors in, never a fourth way around it

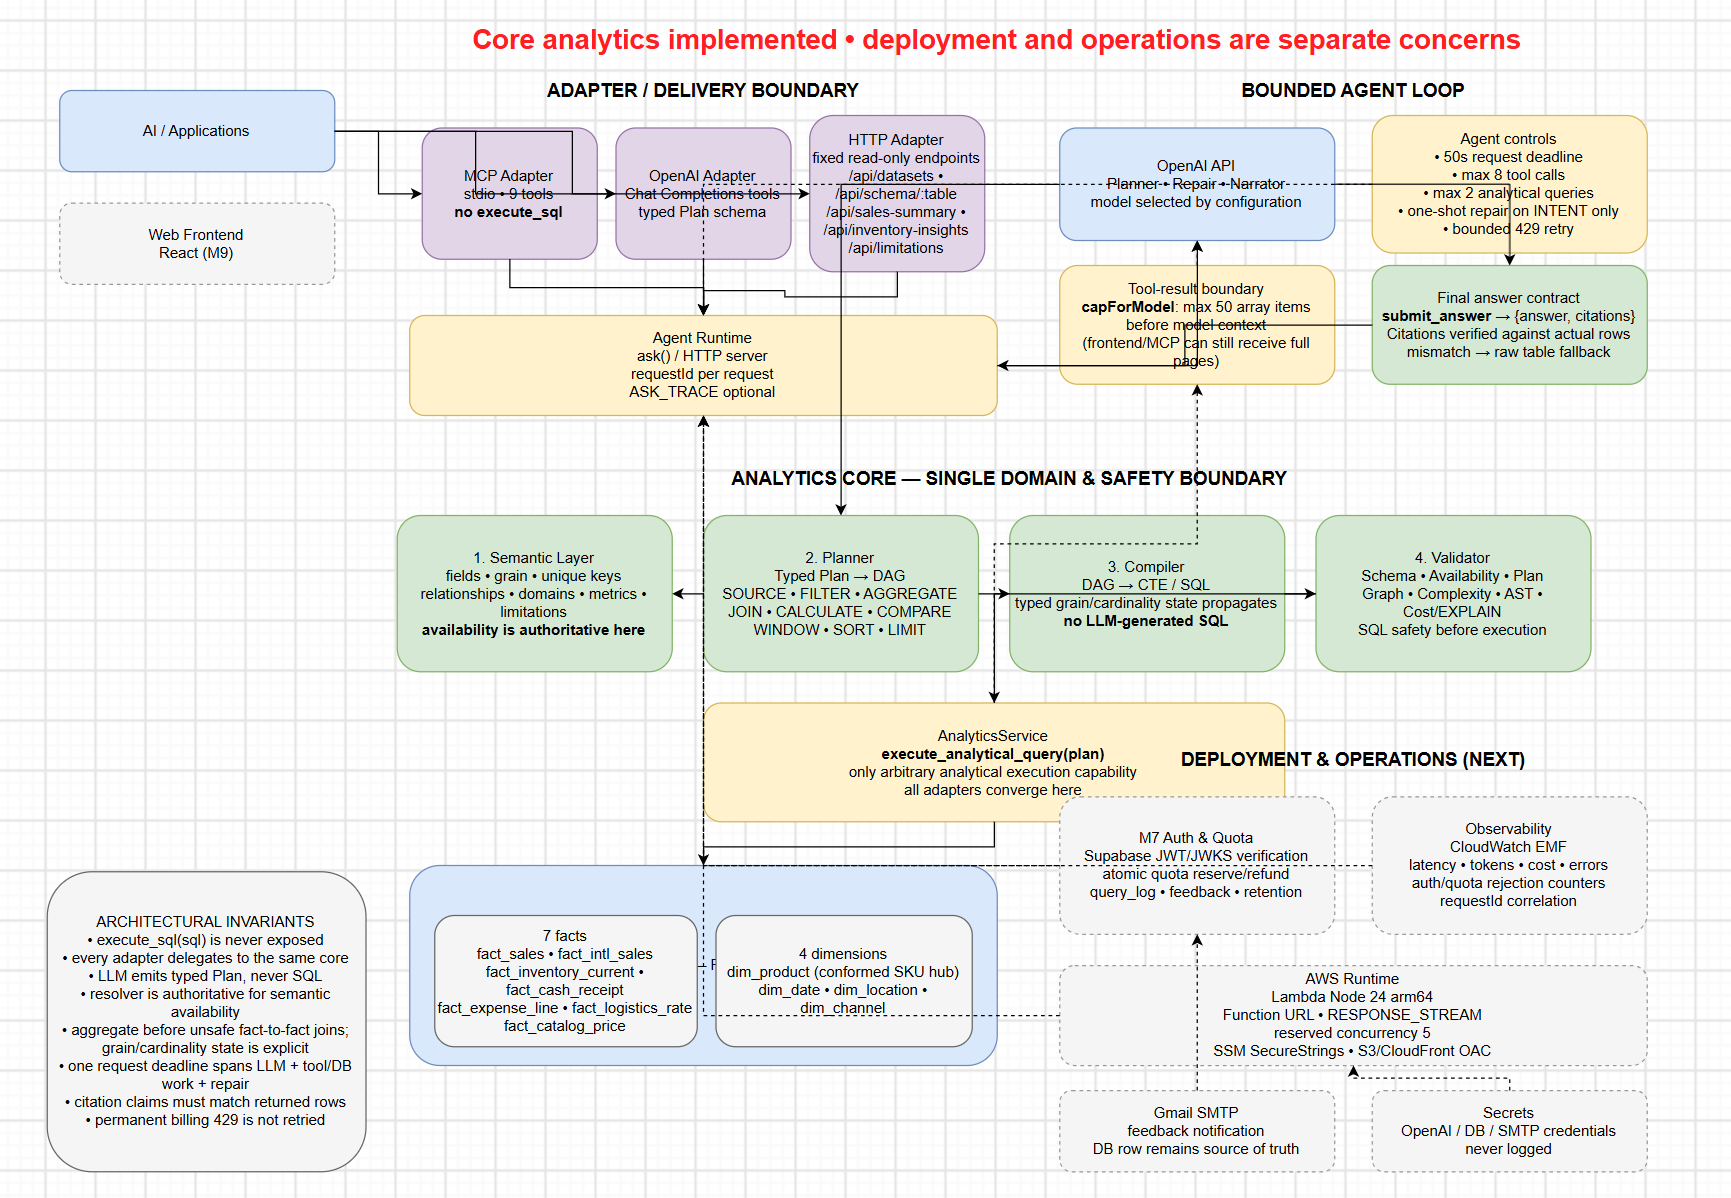
Retail Intelligence Copilot architecture diagram, MCP, OpenAI, and HTTP adapters converging on one analytics core with a semantic layer, planner, compiler, and validator, before Postgres
Three adapters (an MCP server, the OpenAI agent loop, and a plain HTTP API for fixed dashboard specs) all delegate to the same analytics core. None of them has its own opinion about what's safe to run; that decision lives in exactly one place: semantic layer → planner → compiler → validator, in that order, every time. execute_sql is never exposed to any adapter, including the model.

What a CEO actually sees, no jargon, no dead ends

The interface is built for someone who has never heard the words "dimension" or "semantic layer." Every capability below is reachable by clicking, not by knowing the right question to type.

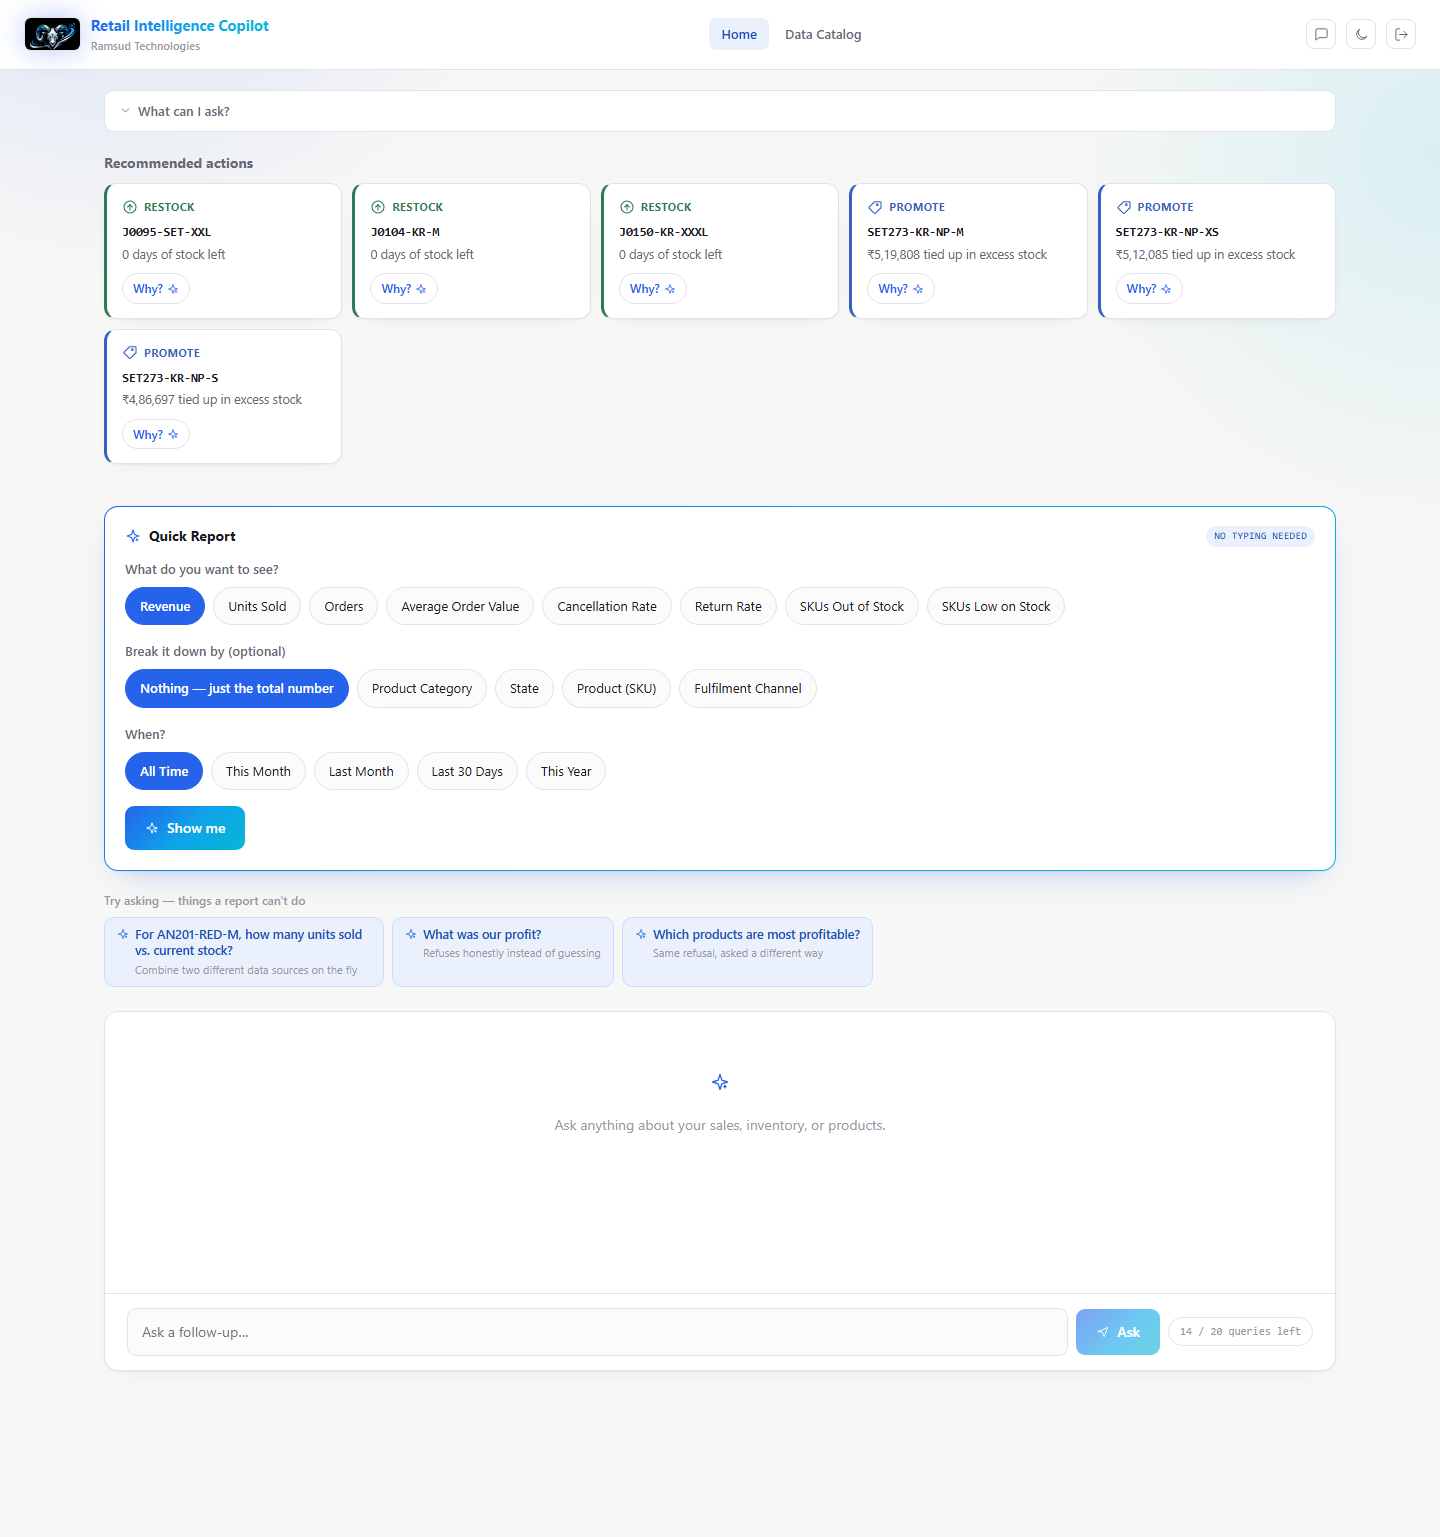
Retail Intelligence Copilot home page, capability panel, recommendation cards, quick report builder, and try-asking prompts
The home screen leads with what the system can do, not a blank chat box: recommendation cards, a no-code report builder, and example prompts for the questions a report structurally can't answer, all before a single word is typed.
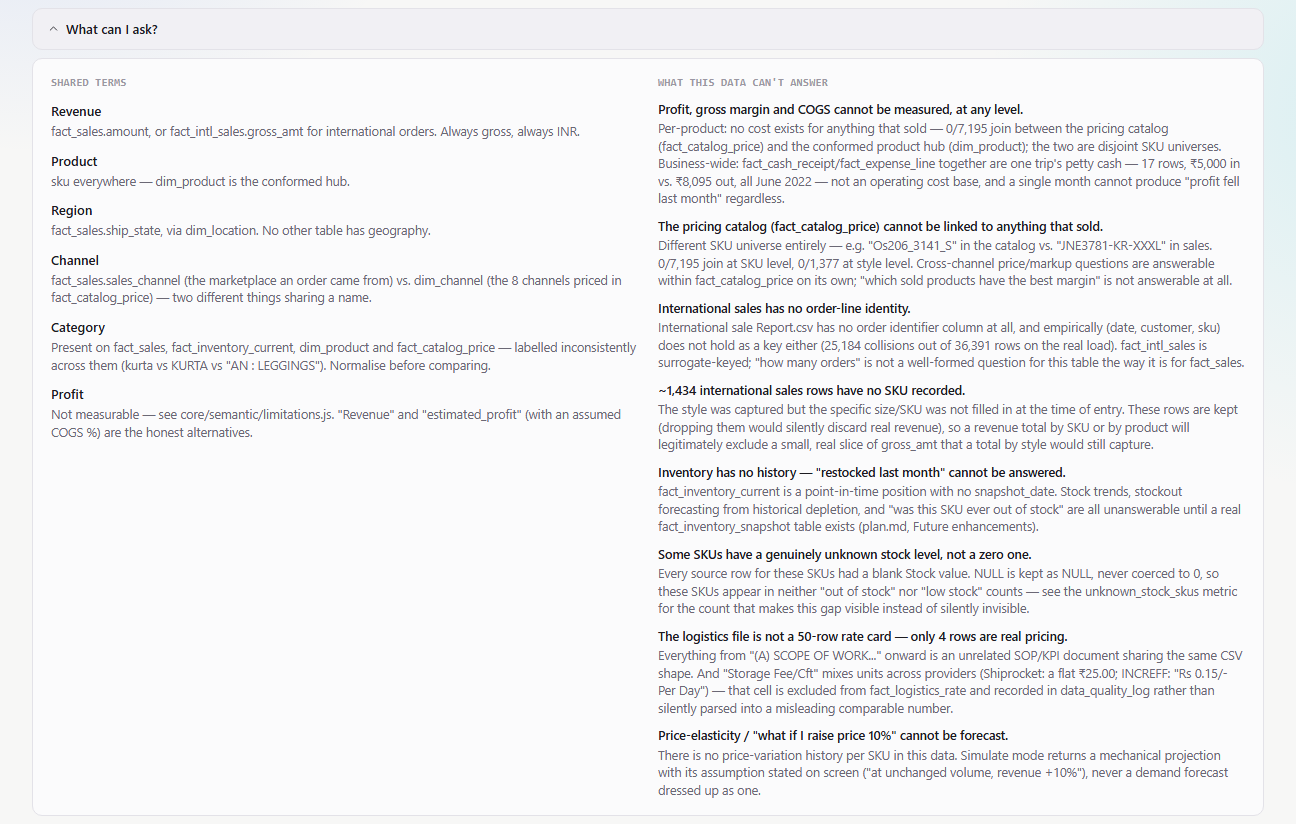
Expanded "What can I ask?" panel showing the metric glossary and declared data limitations
"What can I ask?" surfaces the same declared glossary and limitations the agent itself reads: real boundaries stated up front, not discovered by hitting a refusal mid-conversation.
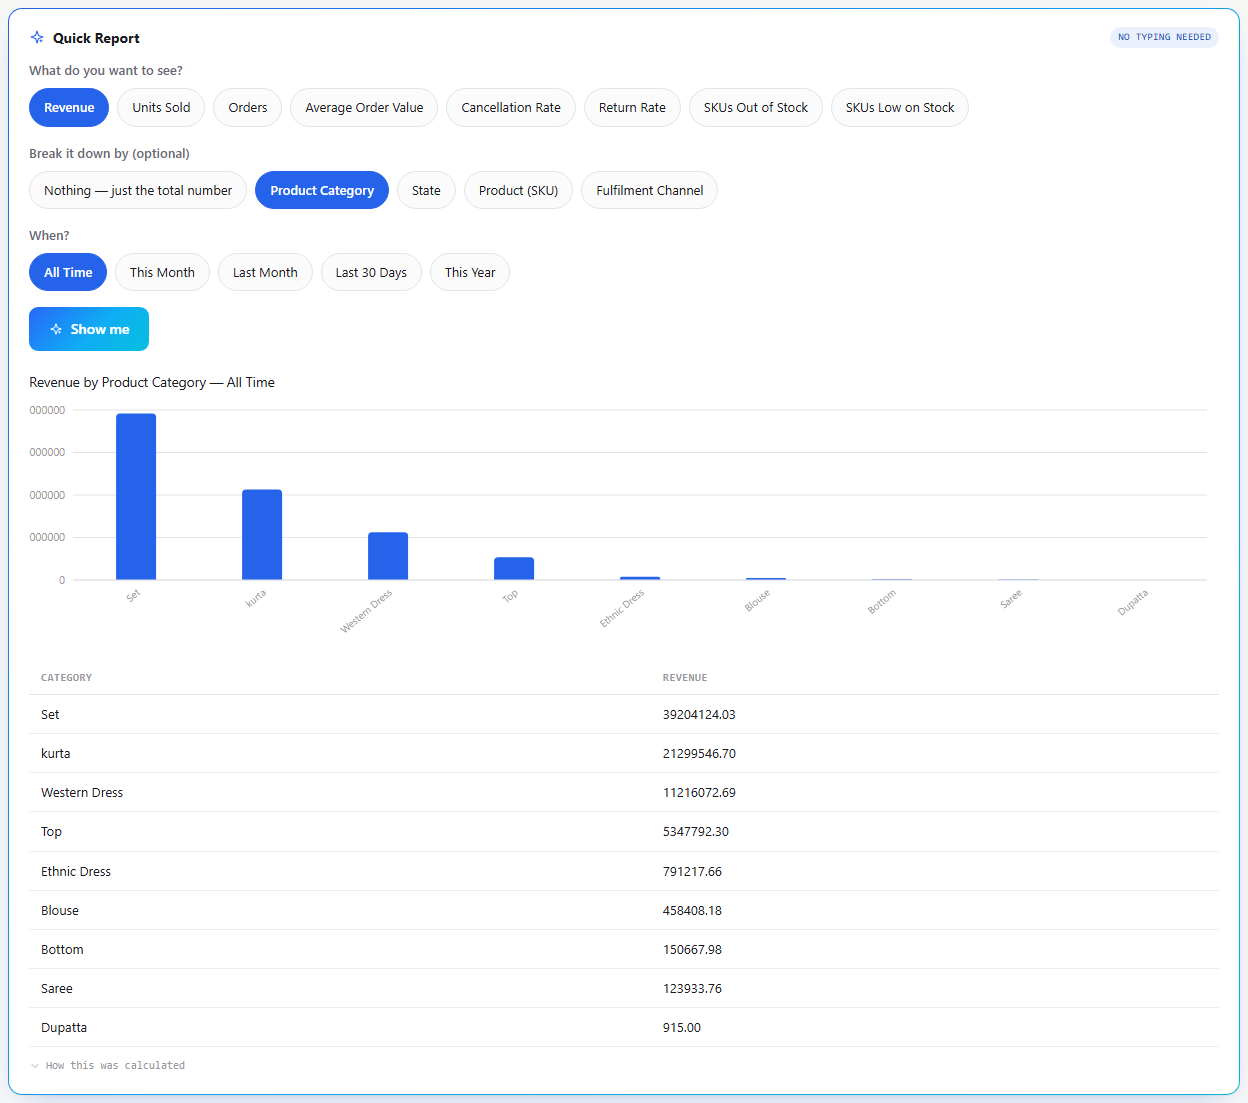
Quick Report builder showing a metric, a breakdown, and a rendered chart with zero AI cost
The Quick Report builder answers "revenue by category" and every question like it with plain-language buttons: same query engine as the chat agent, zero natural-language interpretation, zero AI cost, instant.

The same query engine draws the picture, too

A chart here is never a separate "visualization layer" guessing at intent: it's the literal rows the query returned, rendered with the form that fits the data's own shape. A ranked comparison reads as a bar; a share of a fixed whole reads as a donut. Every number on both charts below is real output from this system, not a mockup.

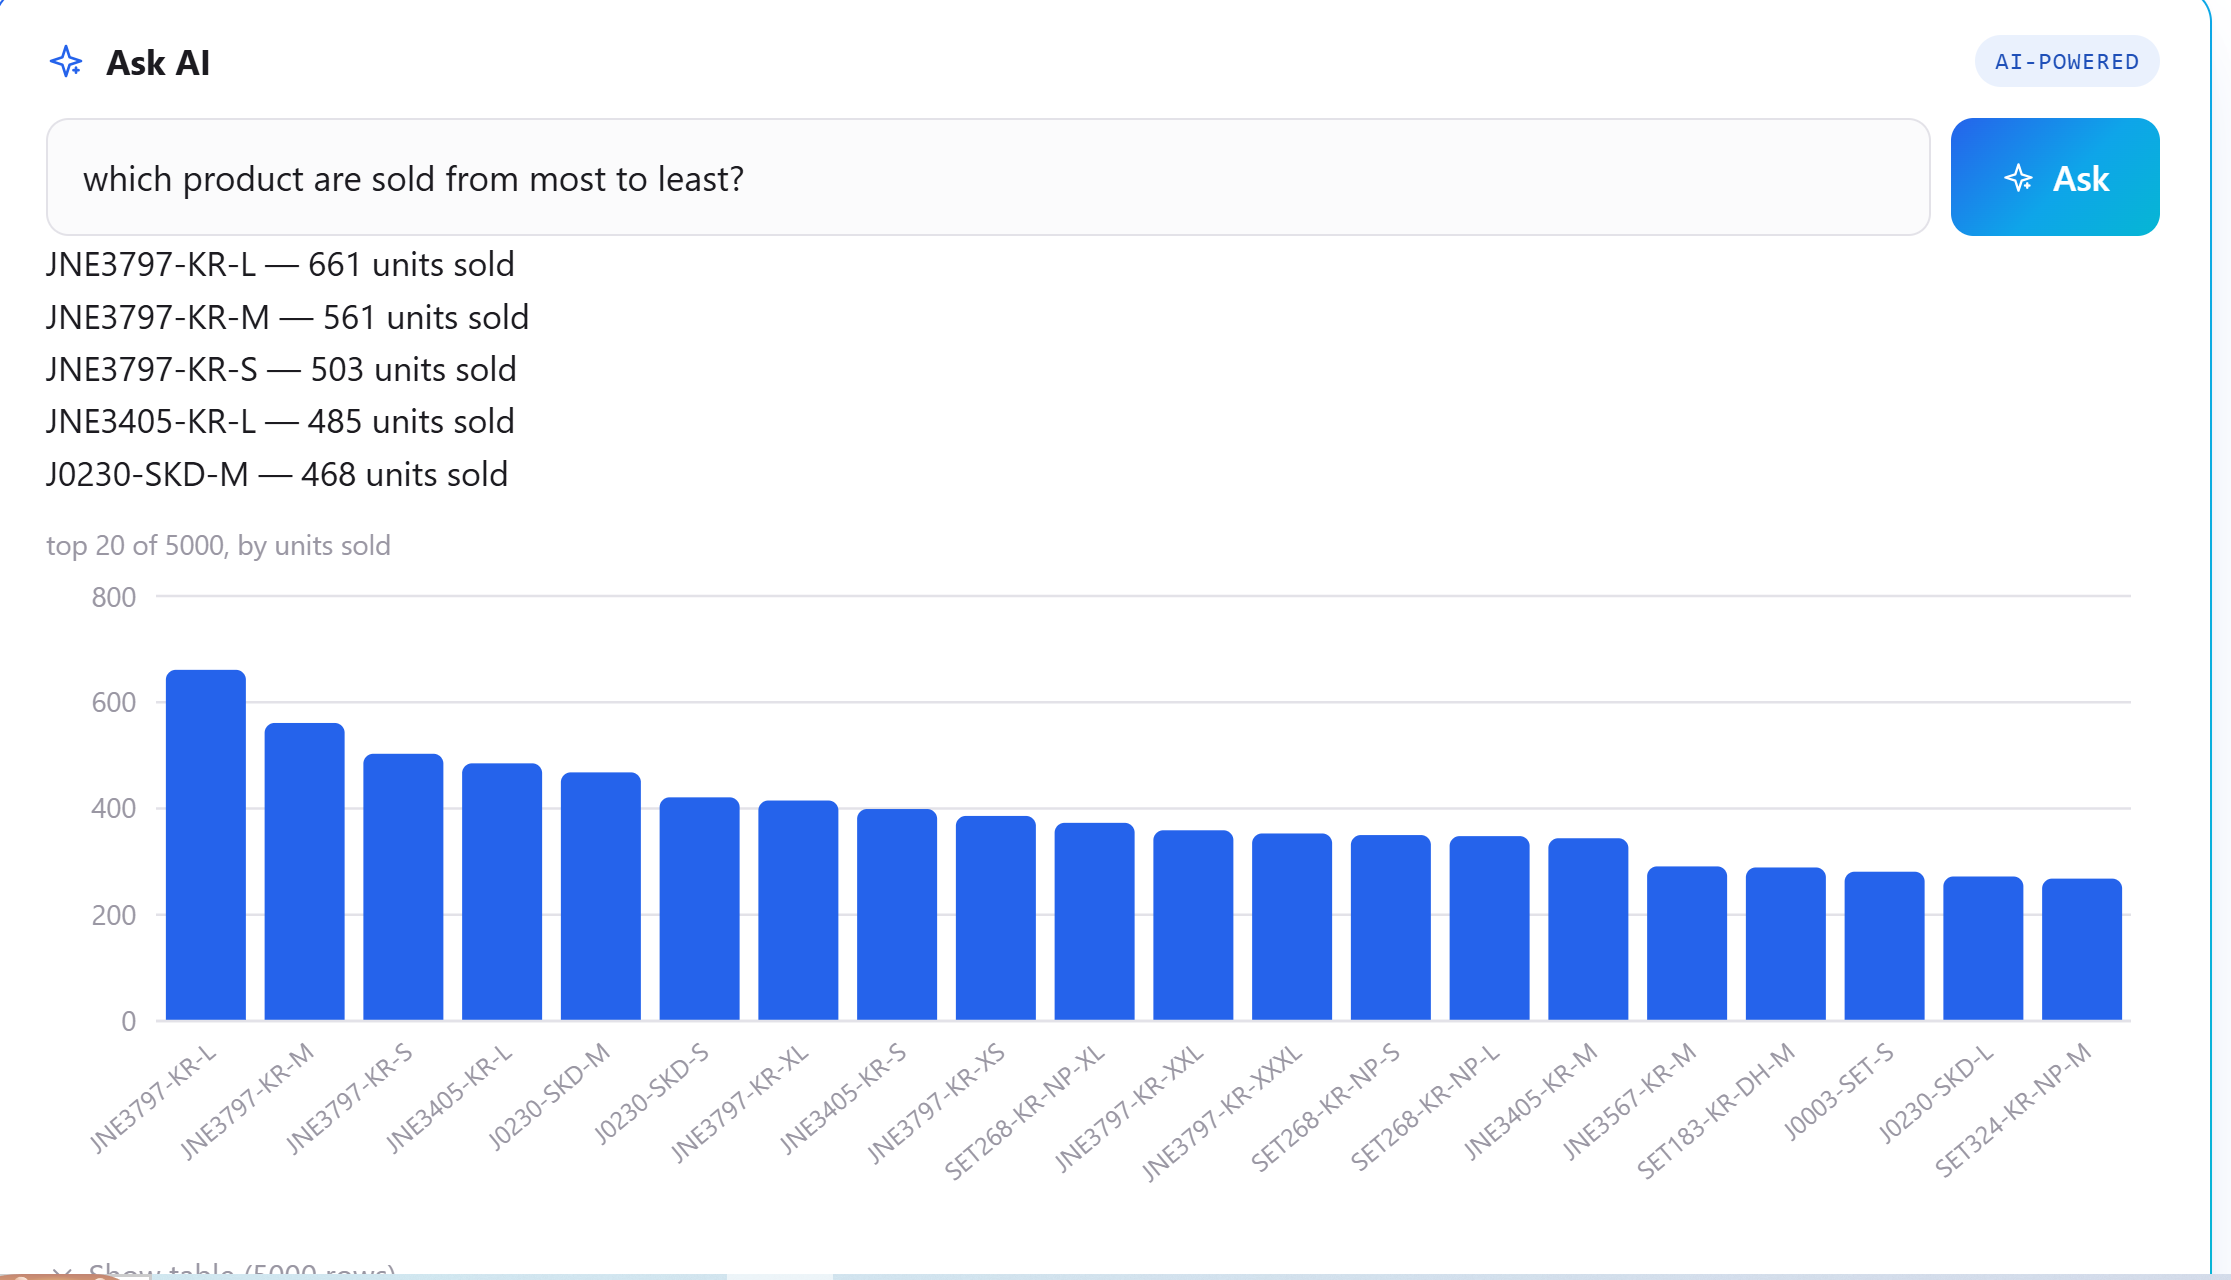
Bar chart of units sold ranked across the top 20 SKUs, drawn from a live query result
Twenty SKUs ranked by units sold: a bar, not a donut, because at this count a pie would force angle-estimation where a bar gives an instant, precise comparison. The chart type isn't chosen by a template; it's chosen by how many categories the result actually has.
Donut chart showing the Restock, Promote, Stop, and Insufficient Data recommendation breakdown across 8.2K SKUs
The full recommendation breakdown across all 8,200+ SKUs is a four-segment split, exactly the case a donut is built for: a share of one fixed whole, read at a glance. The same evidence-gated classification also drives the recommendation cards on the home screen.

What this gives your team beyond another chatbot

Every number is provable, not just plausible

Citations are checked against real query output before an answer ships. A confident-sounding wrong number isn't a risk the reader has to catch themselves.

Answers to questions nobody pre-built a report for

The agent can compose a new answer live, including joining data sources with no pre-declared relationship, instead of only surfacing what an analyst already anticipated.

An honest "I don't know," not a guess

When the data genuinely can't answer a question (no cost data to compute margin, for instance), the system says so plainly, explains why, and offers what it can answer instead.

Routine dashboards stay free and instant

Daily numbers and recommendation cards run through a fixed, deterministic path with zero model calls, no latency, no token cost, for the questions asked every single day.

One semantic layer, every consumer

The chat agent, a no-AI report builder, and the pinned dashboard cards all read the same declared metric and join definitions: "revenue" can't quietly mean something different depending on which screen you're looking at.

Cost and abuse control built in from day one

Every request is authenticated before it can spend a token, and a per-user query quota is enforced atomically, proven under real concurrent load, not just assumed safe.

The engineering that makes the trust model hold in production

Semantic layer

  • Fields, grain, and join relationships declared once, in code
  • Metrics carry expression trees, never hand-written SQL strings
  • Unavailable metrics refuse with a reason and real alternatives, not a generic error

Query pipeline

  • A strictly-typed, versioned query plan schema, no free-form input reaches the compiler
  • A dedicated compiler is the only thing that ever emits SQL
  • One narrow, bounded repair attempt on a failed plan, never a second open-ended try

Agent runtime

  • A bounded tool-call loop, capped calls, one shared deadline across every step
  • Model choice is configuration, not a hard-coded string, per role in the pipeline
  • Streaming-ready on AWS Lambda Function URLs, no API Gateway in the path

Trust layer

  • Every citation checked against real result rows before an answer ships
  • Data-quality disclosure surfaced on any answer built from an imperfect join
  • A refusal that generalizes across how a question is phrased, not a keyword match

Auth & cost control

  • JWT verification before any model call, an unauthenticated request never spends a token
  • Atomic, race-proof per-user query quota, not a check-then-write that concurrency can break
  • Full observability, latency, token cost, and error class, per request

Deployment

  • Infrastructure as code end to end, reviewed before anything is ever applied
  • Secrets never logged, by construction, not by discipline
  • A single CDN origin for both the app and its API, so the browser never needs CORS

Same shape as tools like Amazon Q in QuickSight. Different guarantee.

Modern AI-in-BI tools already follow roughly this shape: a question, an LLM, a declared semantic layer, a generated query, and a written explanation on top. That's not a difference worth pretending doesn't exist. What's provable is what happens on the last mile: the explanation itself.

Shared shape Semantic layer + LLM + generated query
  • A business-meaning layer between raw columns and the model; neither approach lets the AI touch raw data blind
  • Natural language in, a generated query out, run against real data
  • Results return as charts, KPIs, and a written explanation, not a bare table
What we can prove, tested end to end A verification step on the explanation itself
  • Every number in the explanation is checked, in code, against the literal query result before it ships
  • A mismatch withholds the sentence and shows the raw numbers instead, never a plausible-sounding guess
  • The same refusal holds across different phrasings of one unanswerable question
  • Ad-hoc joins composed live across tables with no pre-declared relationship
  • Routine questions run a separate, free, zero-AI path; the model is spent only where a fixed report can't reach

We never claim to know the internals of a specific competitor's product we haven't verified firsthand. That's not a standard we'd want held to the reverse way either. What's above is what we built and tested, not a claim about what anyone else's tool can't do.

Built deterministic first, proven correct, then handed to a model

We built the query engine and validated it against its own worked examples before a single model call was ever wired in, so when the agent produces a plan, it's targeting a pipeline already proven correct, not debugging the model and the compiler at the same time. Every trust guarantee in this platform is backed by a real test against real infrastructure: a genuine 25-concurrent-connection race condition proving the quota system can't be gamed, a live model call proving a citation mismatch actually degrades to the raw table, a forced credential in a log line proving it never appears in output.

If a claim about this system can't be demonstrated against real data, live, on request, we don't make it. That standard is slower to build to and it's the only one worth building an AI product on.

Where we help most

AI dashboard & copilot design LLM-safe query architecture Semantic layer engineering Retrieval-grounded verification AWS serverless deployment Auth, quota & cost control

Ready for a dashboard that reasons instead of just displaying?

Whether you're evaluating an AI-in-BI vendor or want a copilot built on your own data model, we can walk through this architecture live, including the moment it says "I don't know."

Book an AI Dashboard Call Explore Our Services