01 — DEPLOYMENT
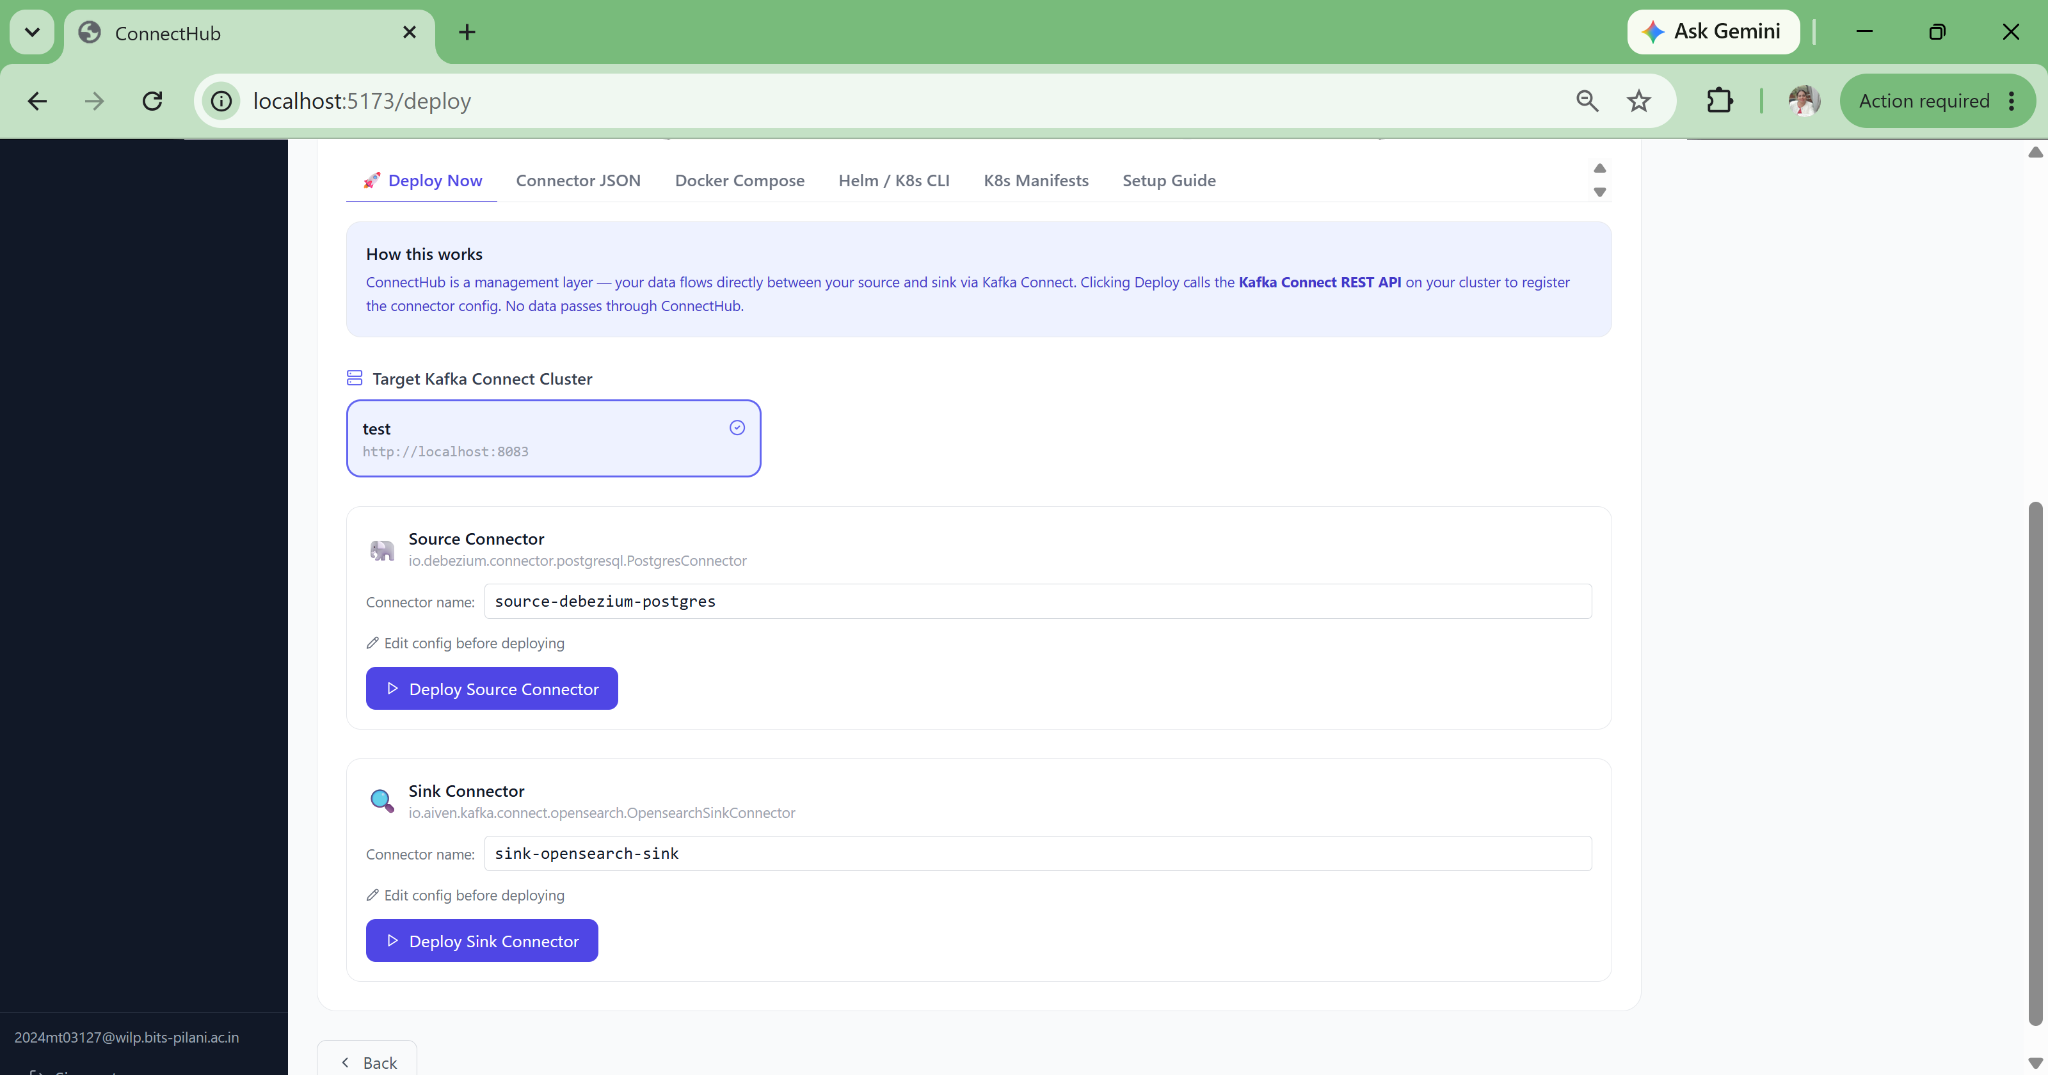
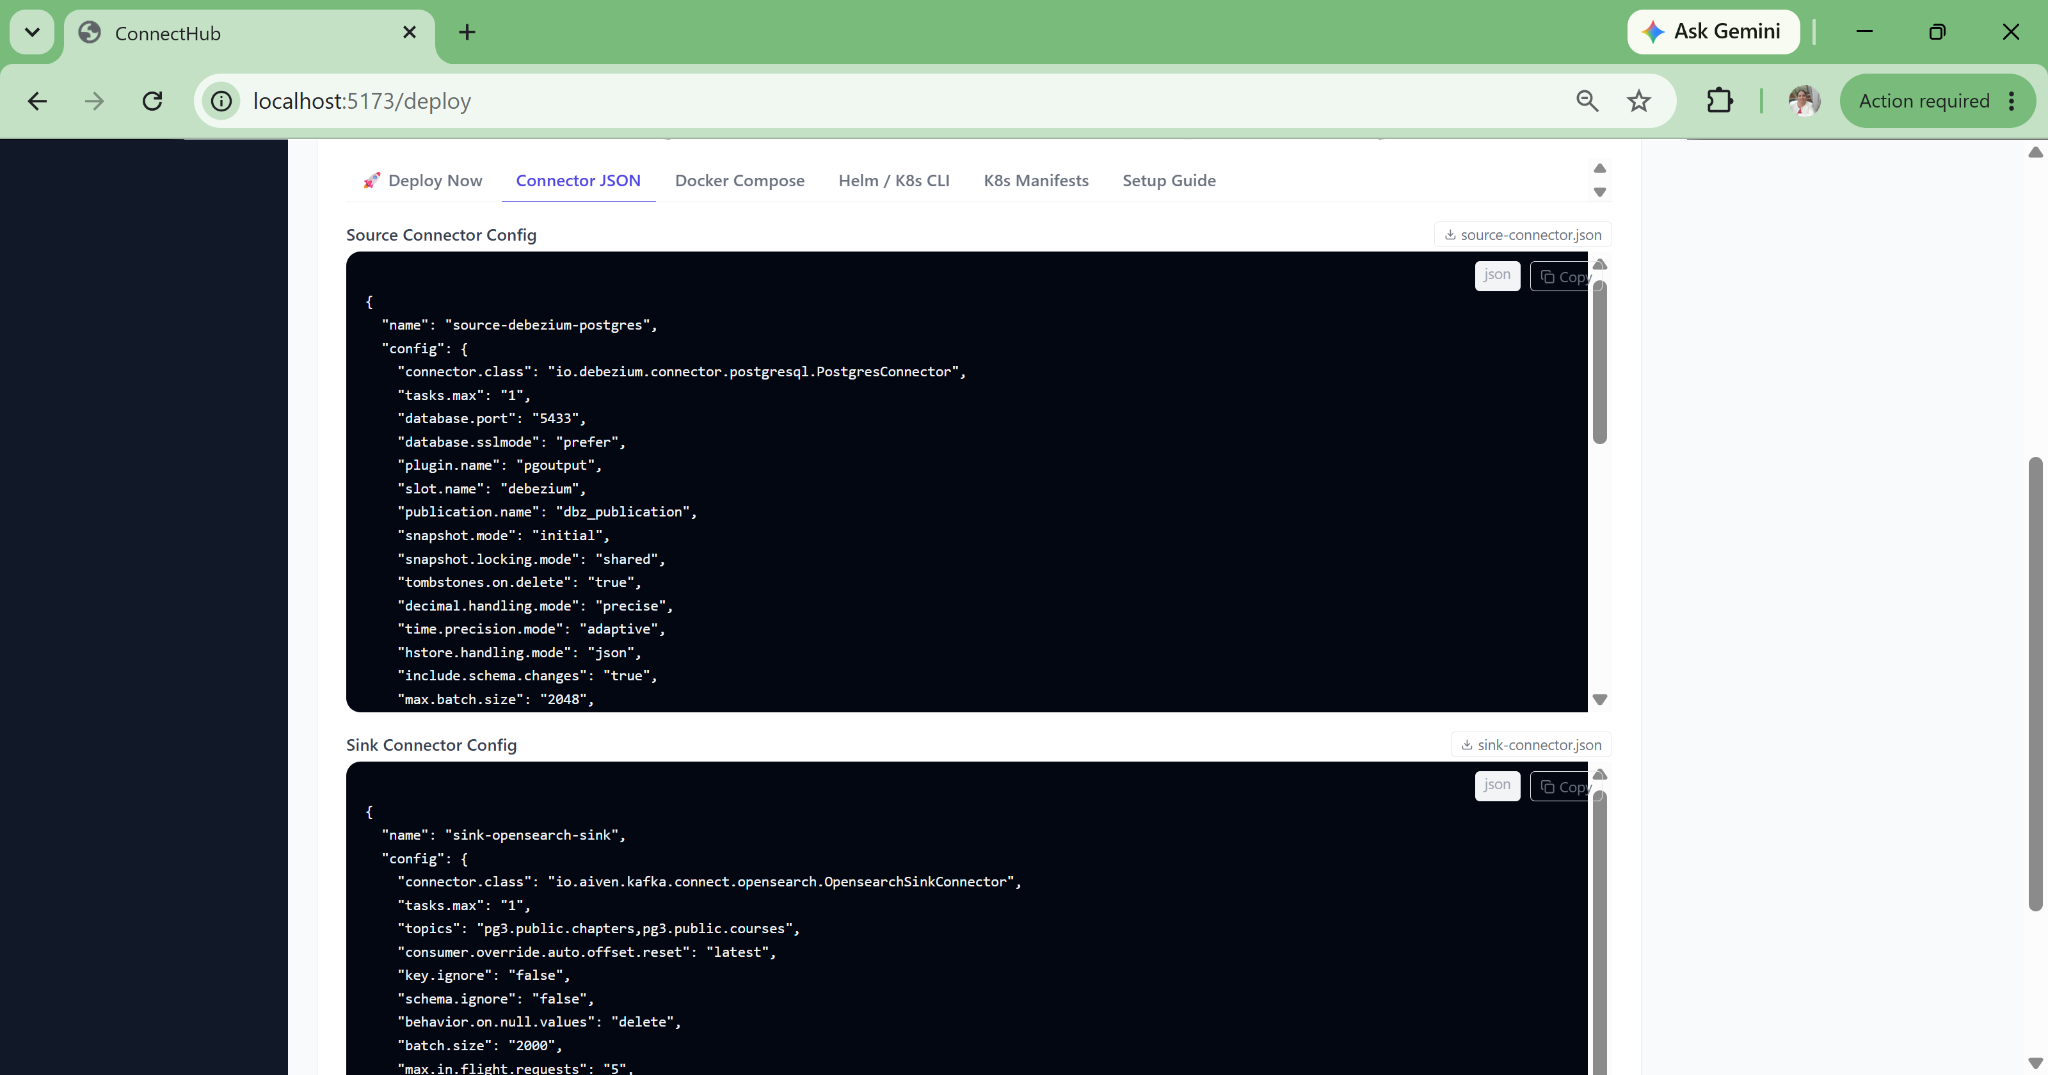
Zero-JSON Pipeline Deployment
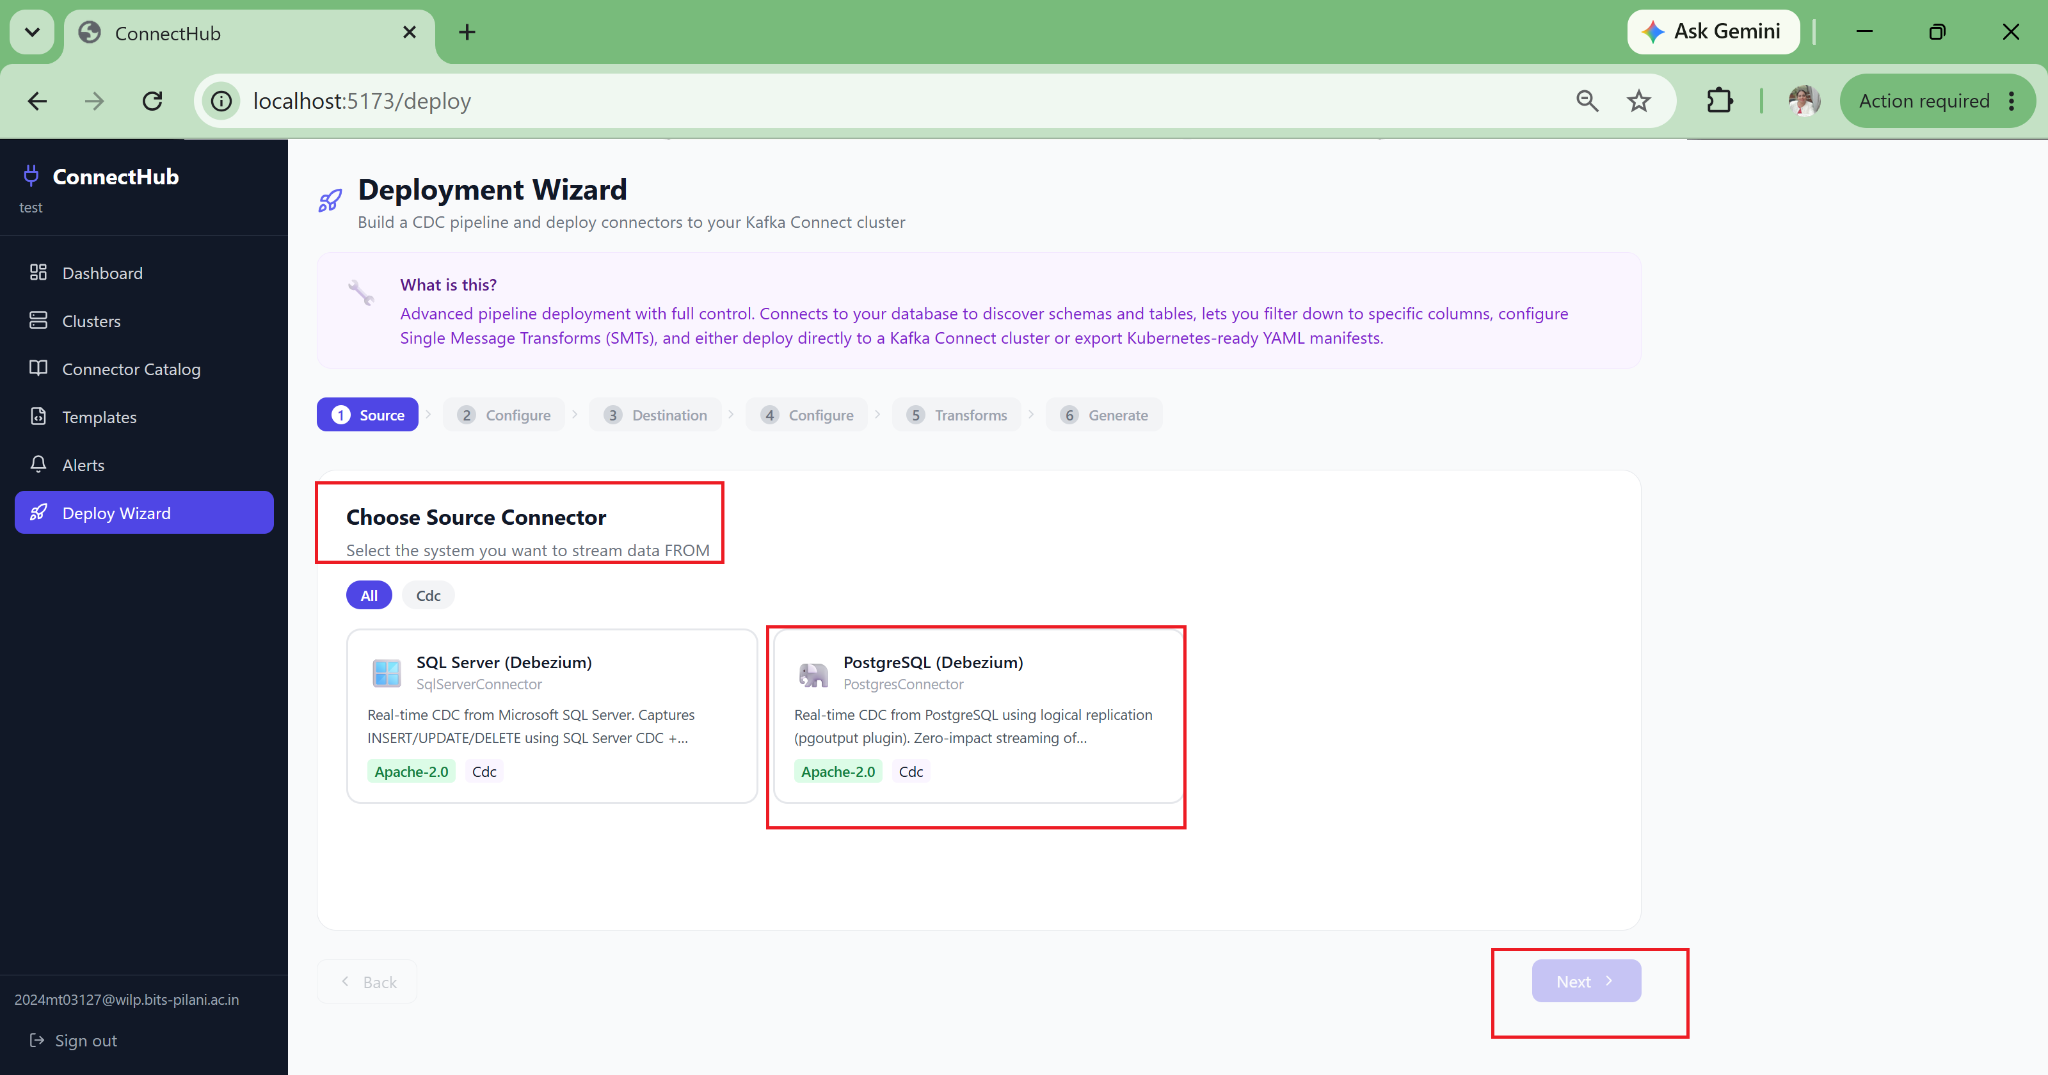
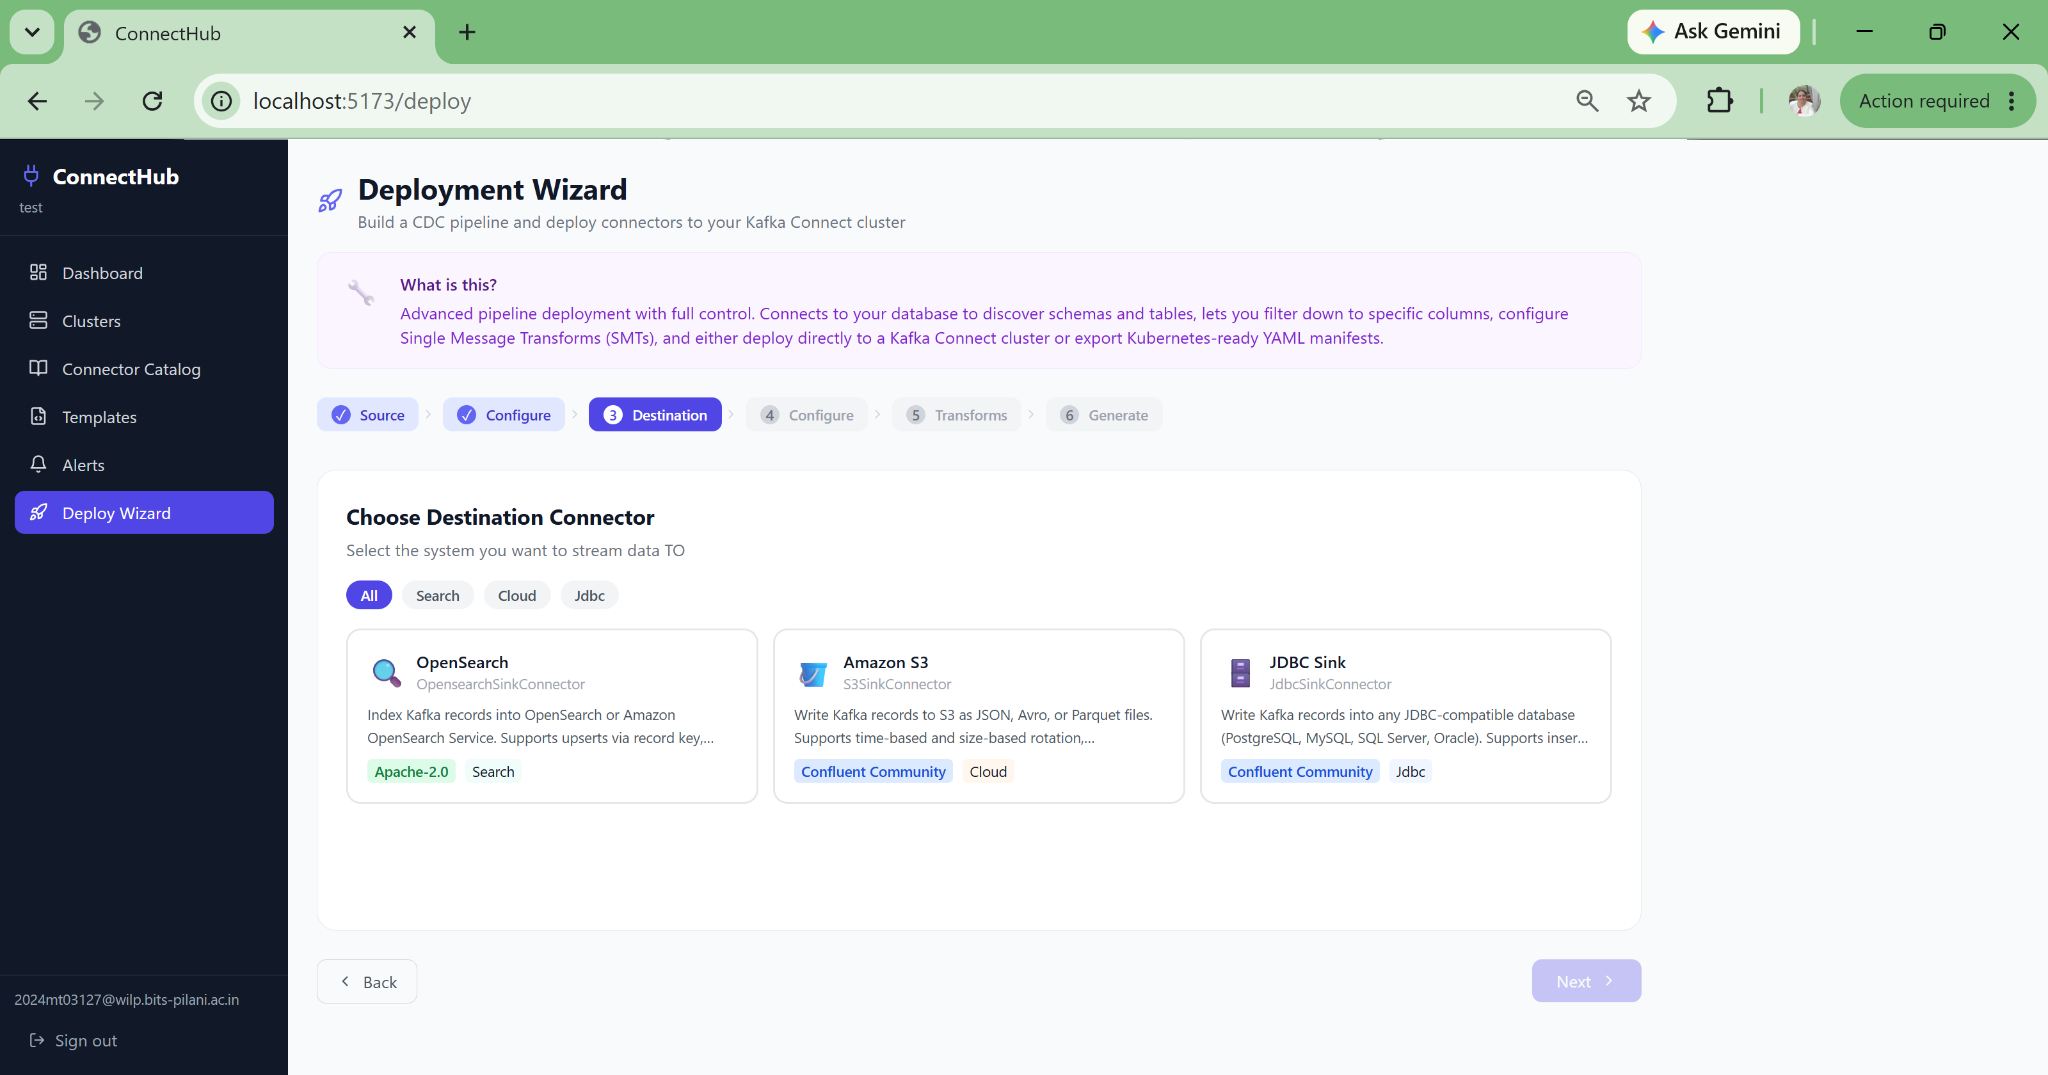
The wizard fills safe defaults for 80+ connector properties, auto-derives Kafka topic names, and deploys directly. A new data engineer can deploy a production Debezium CDC pipeline on their first day with no documentation required.
Core Feature
02 — SCHEMA DISCOVERY
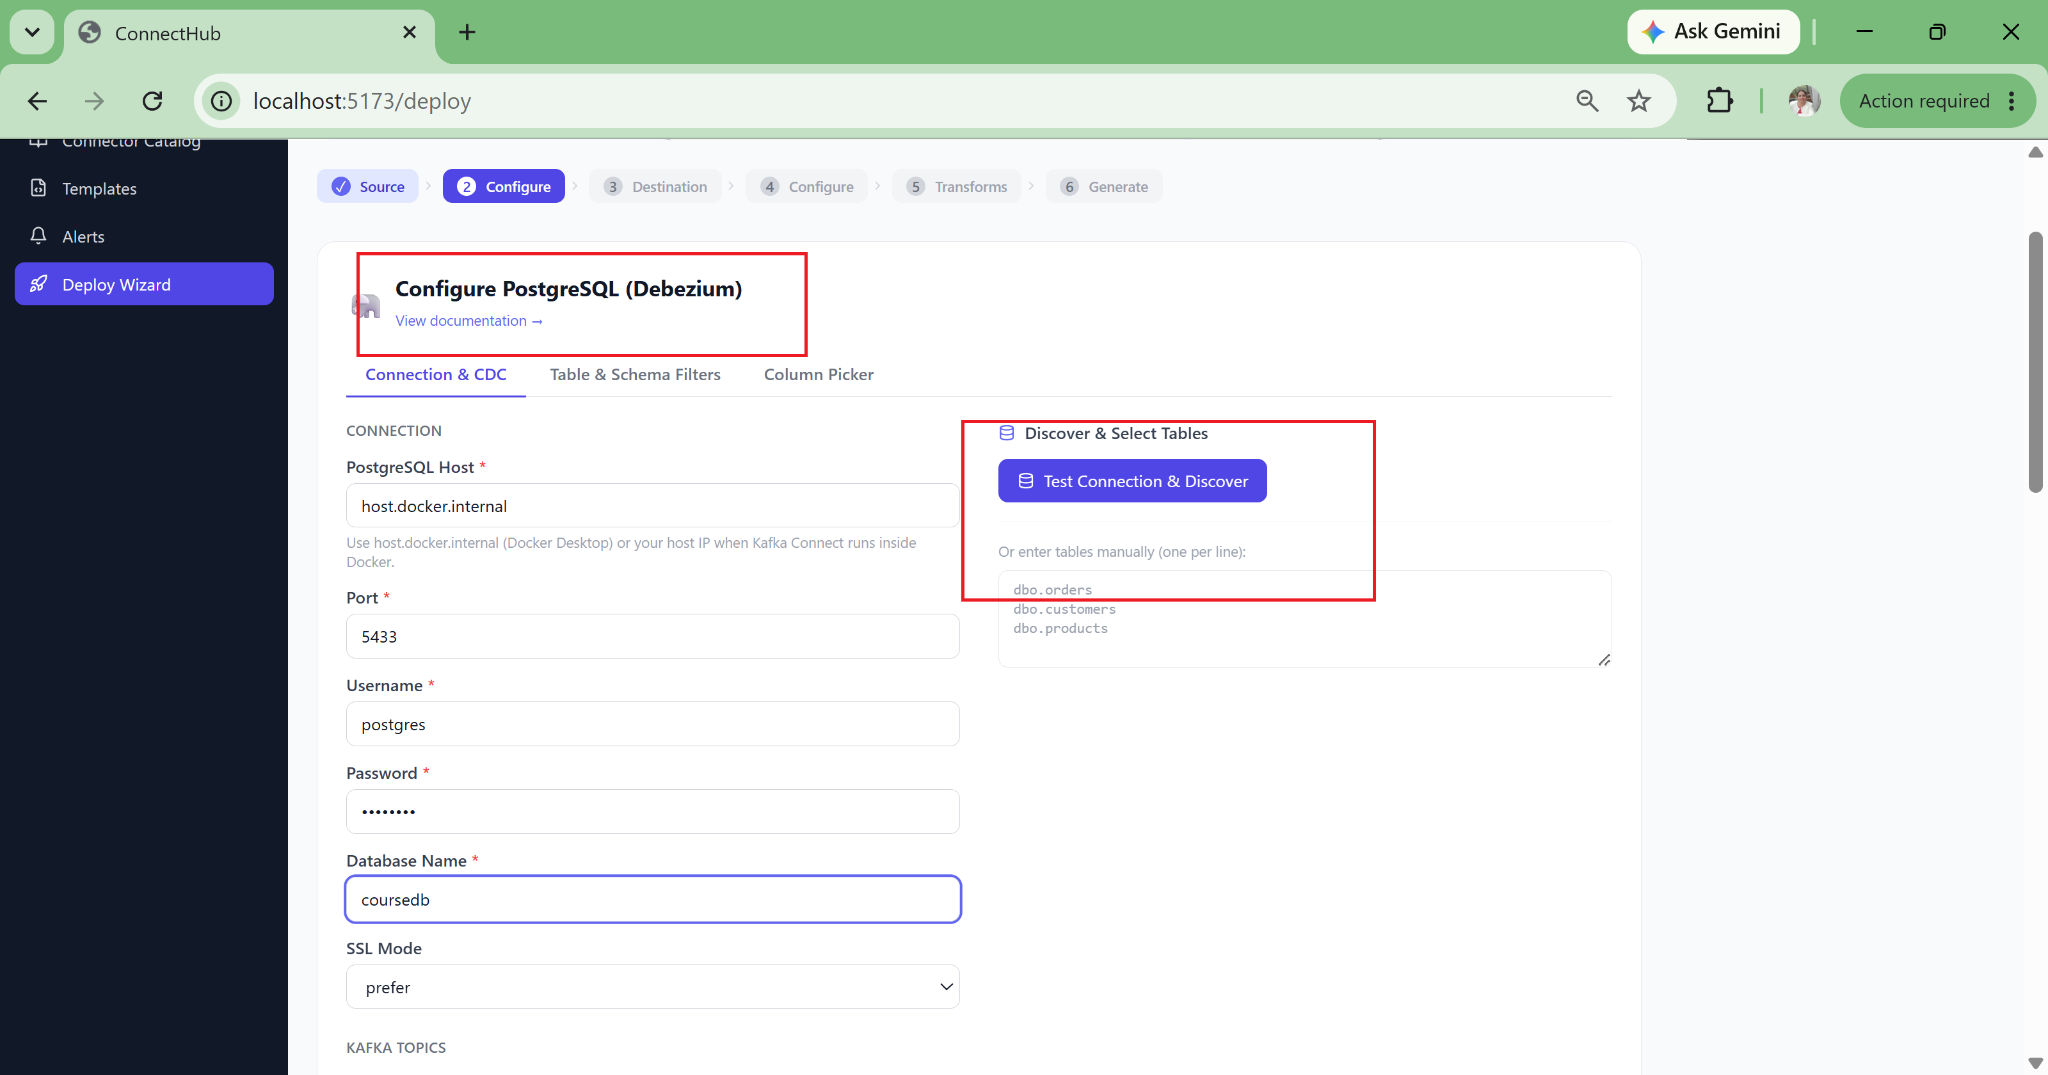
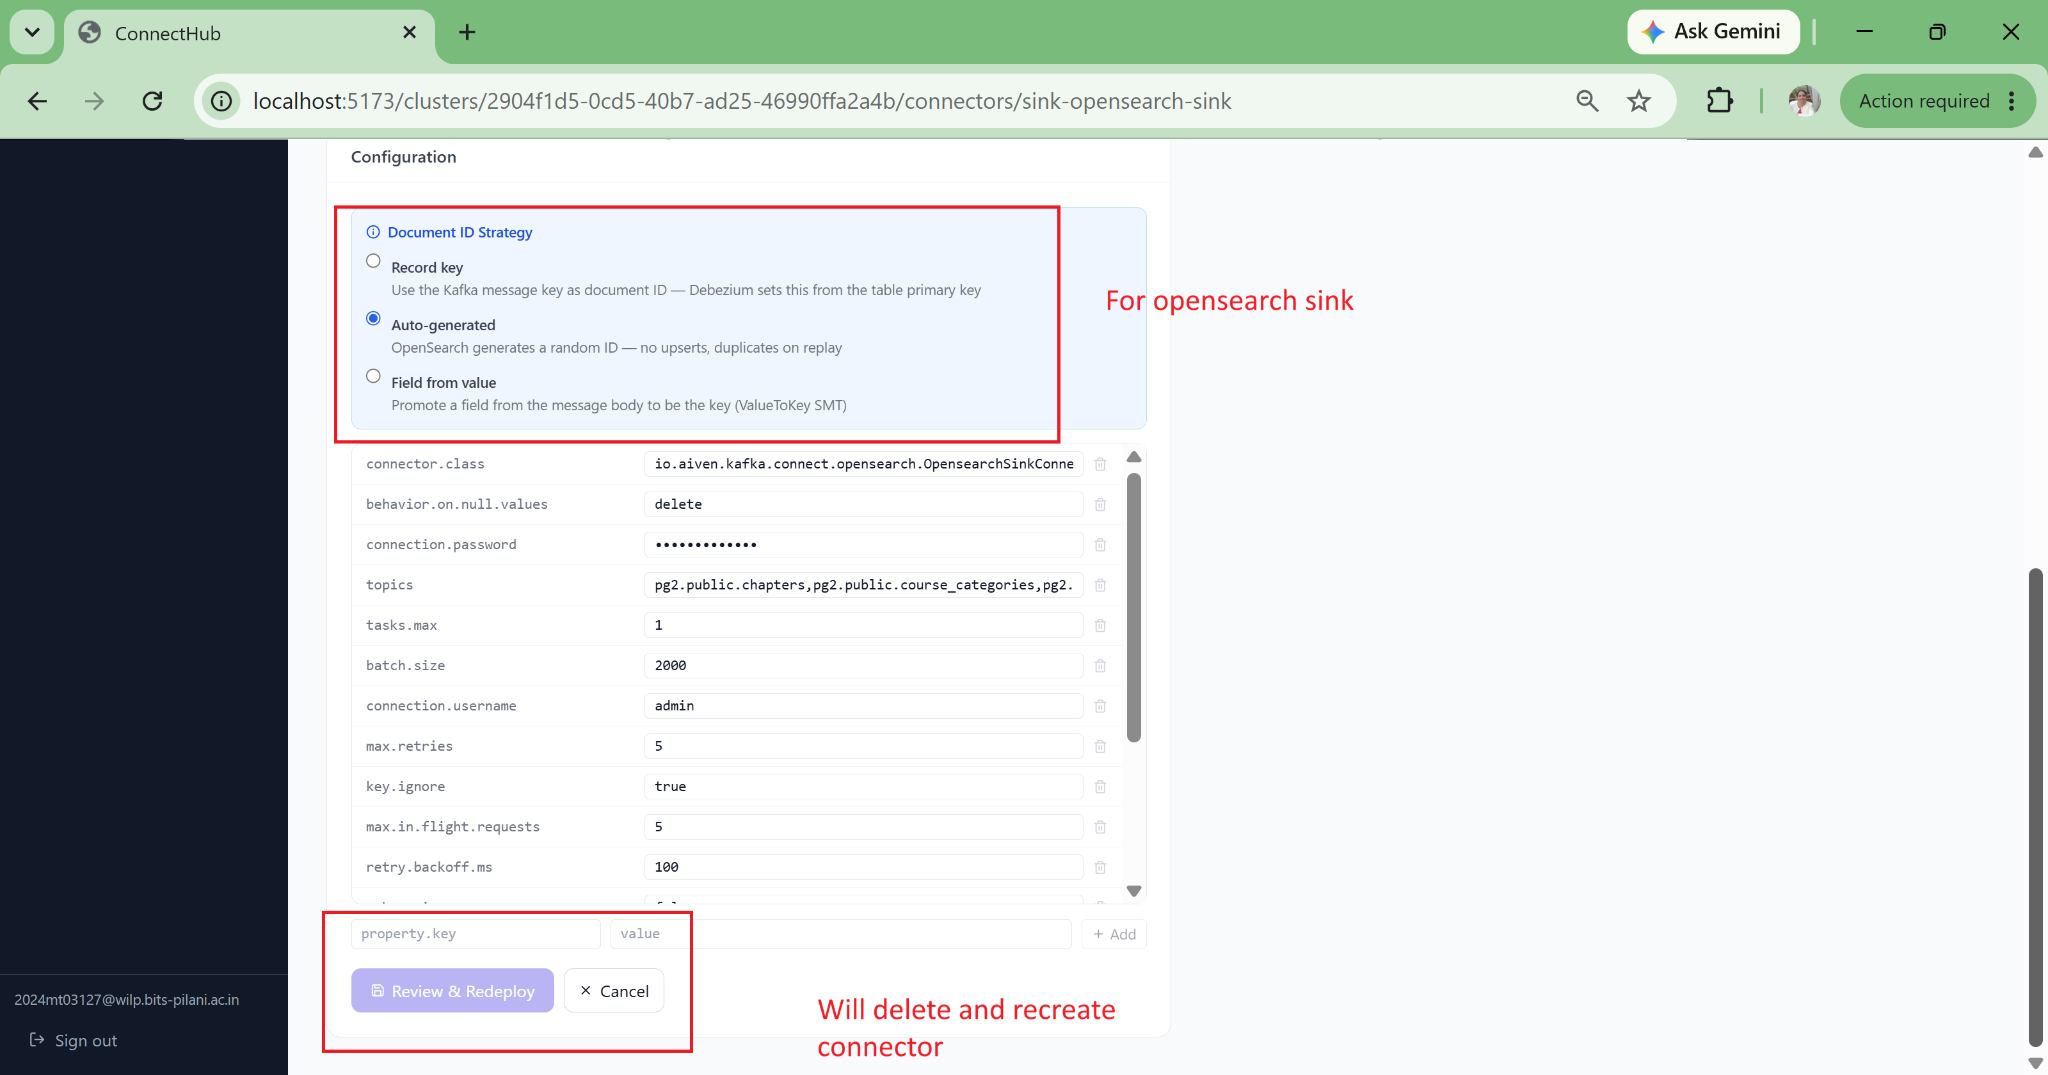
Live Database Schema Discovery via JDBC
Connects to your source database at configuration time and enumerates every table, every column, every data type in a point-and-click interface. Eliminates the typos in table.include.list that cause silent data quality failures at snapshot time.
Core Feature
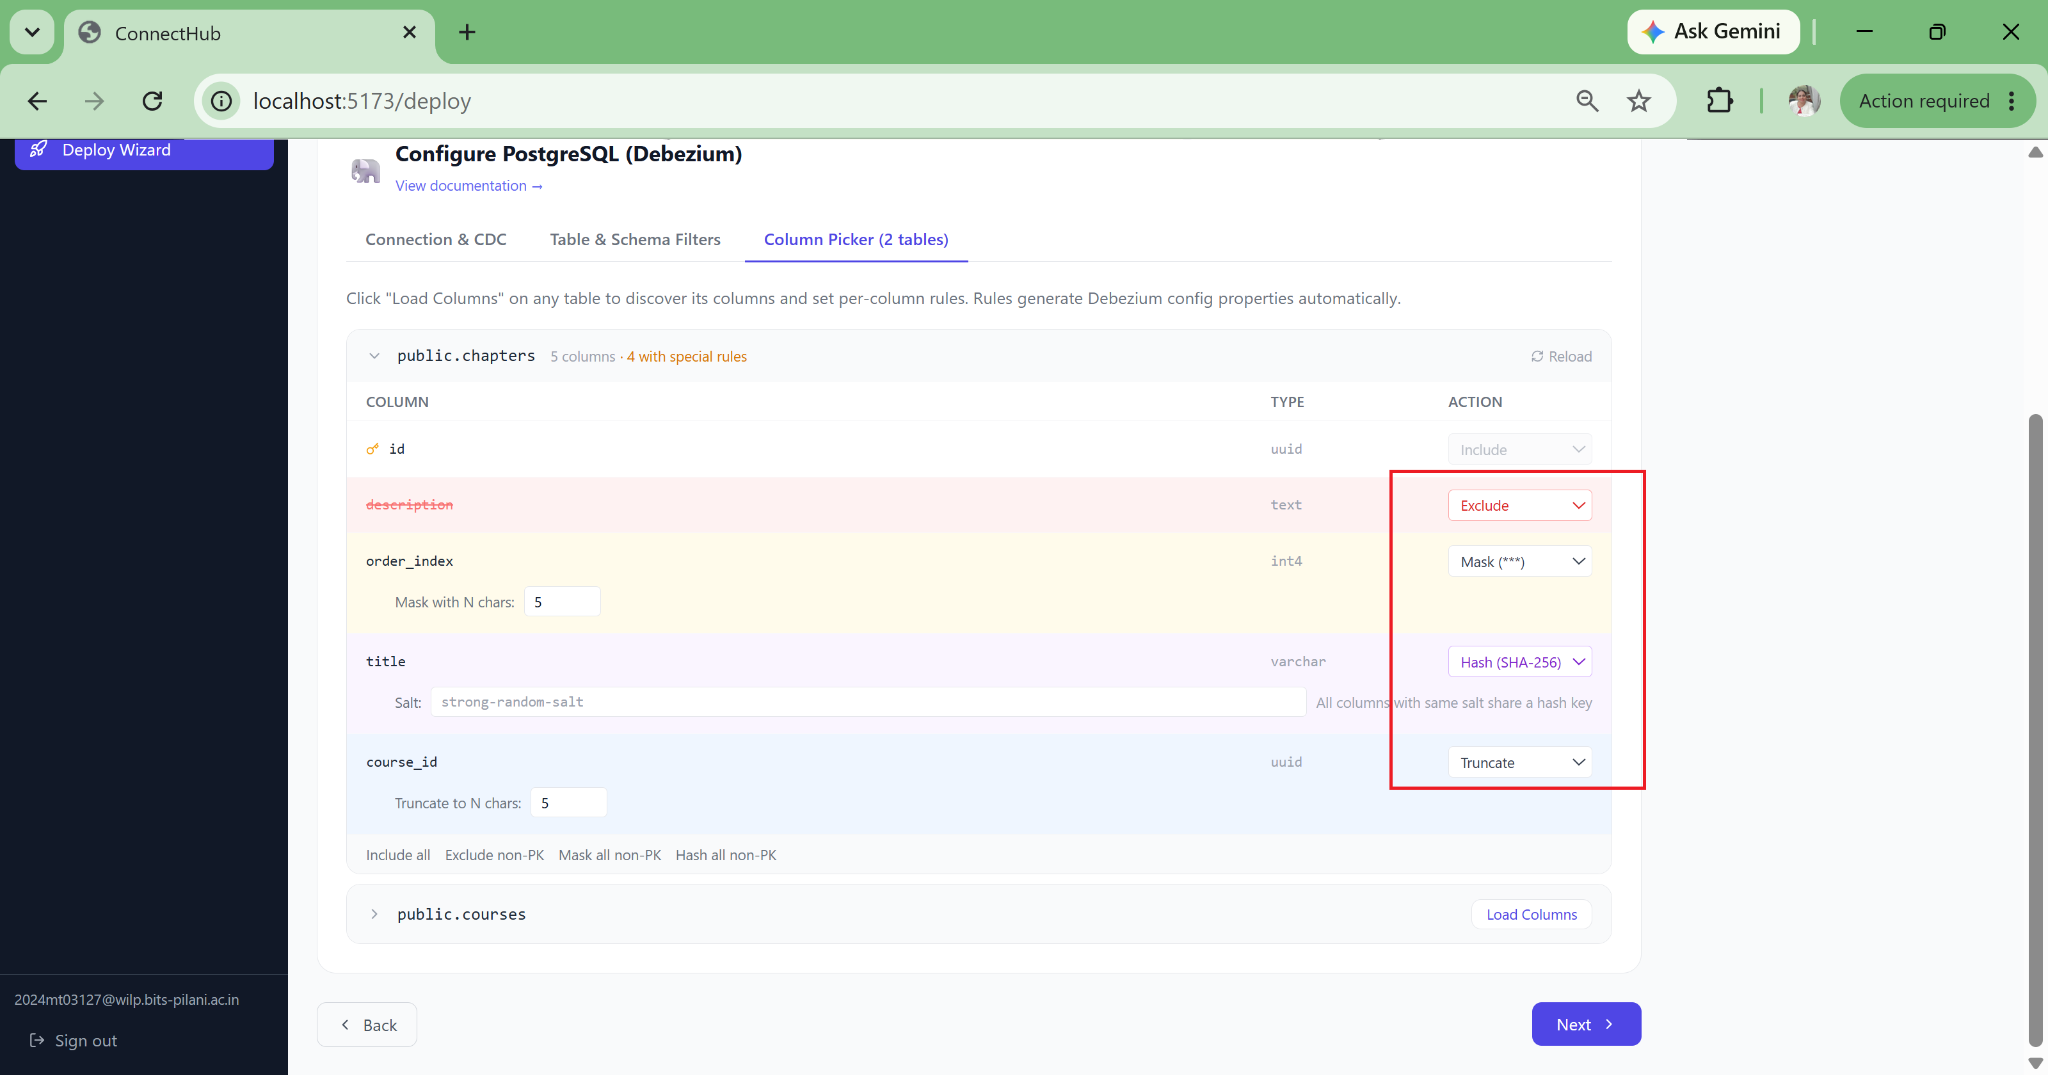
03 — COMPLIANCE
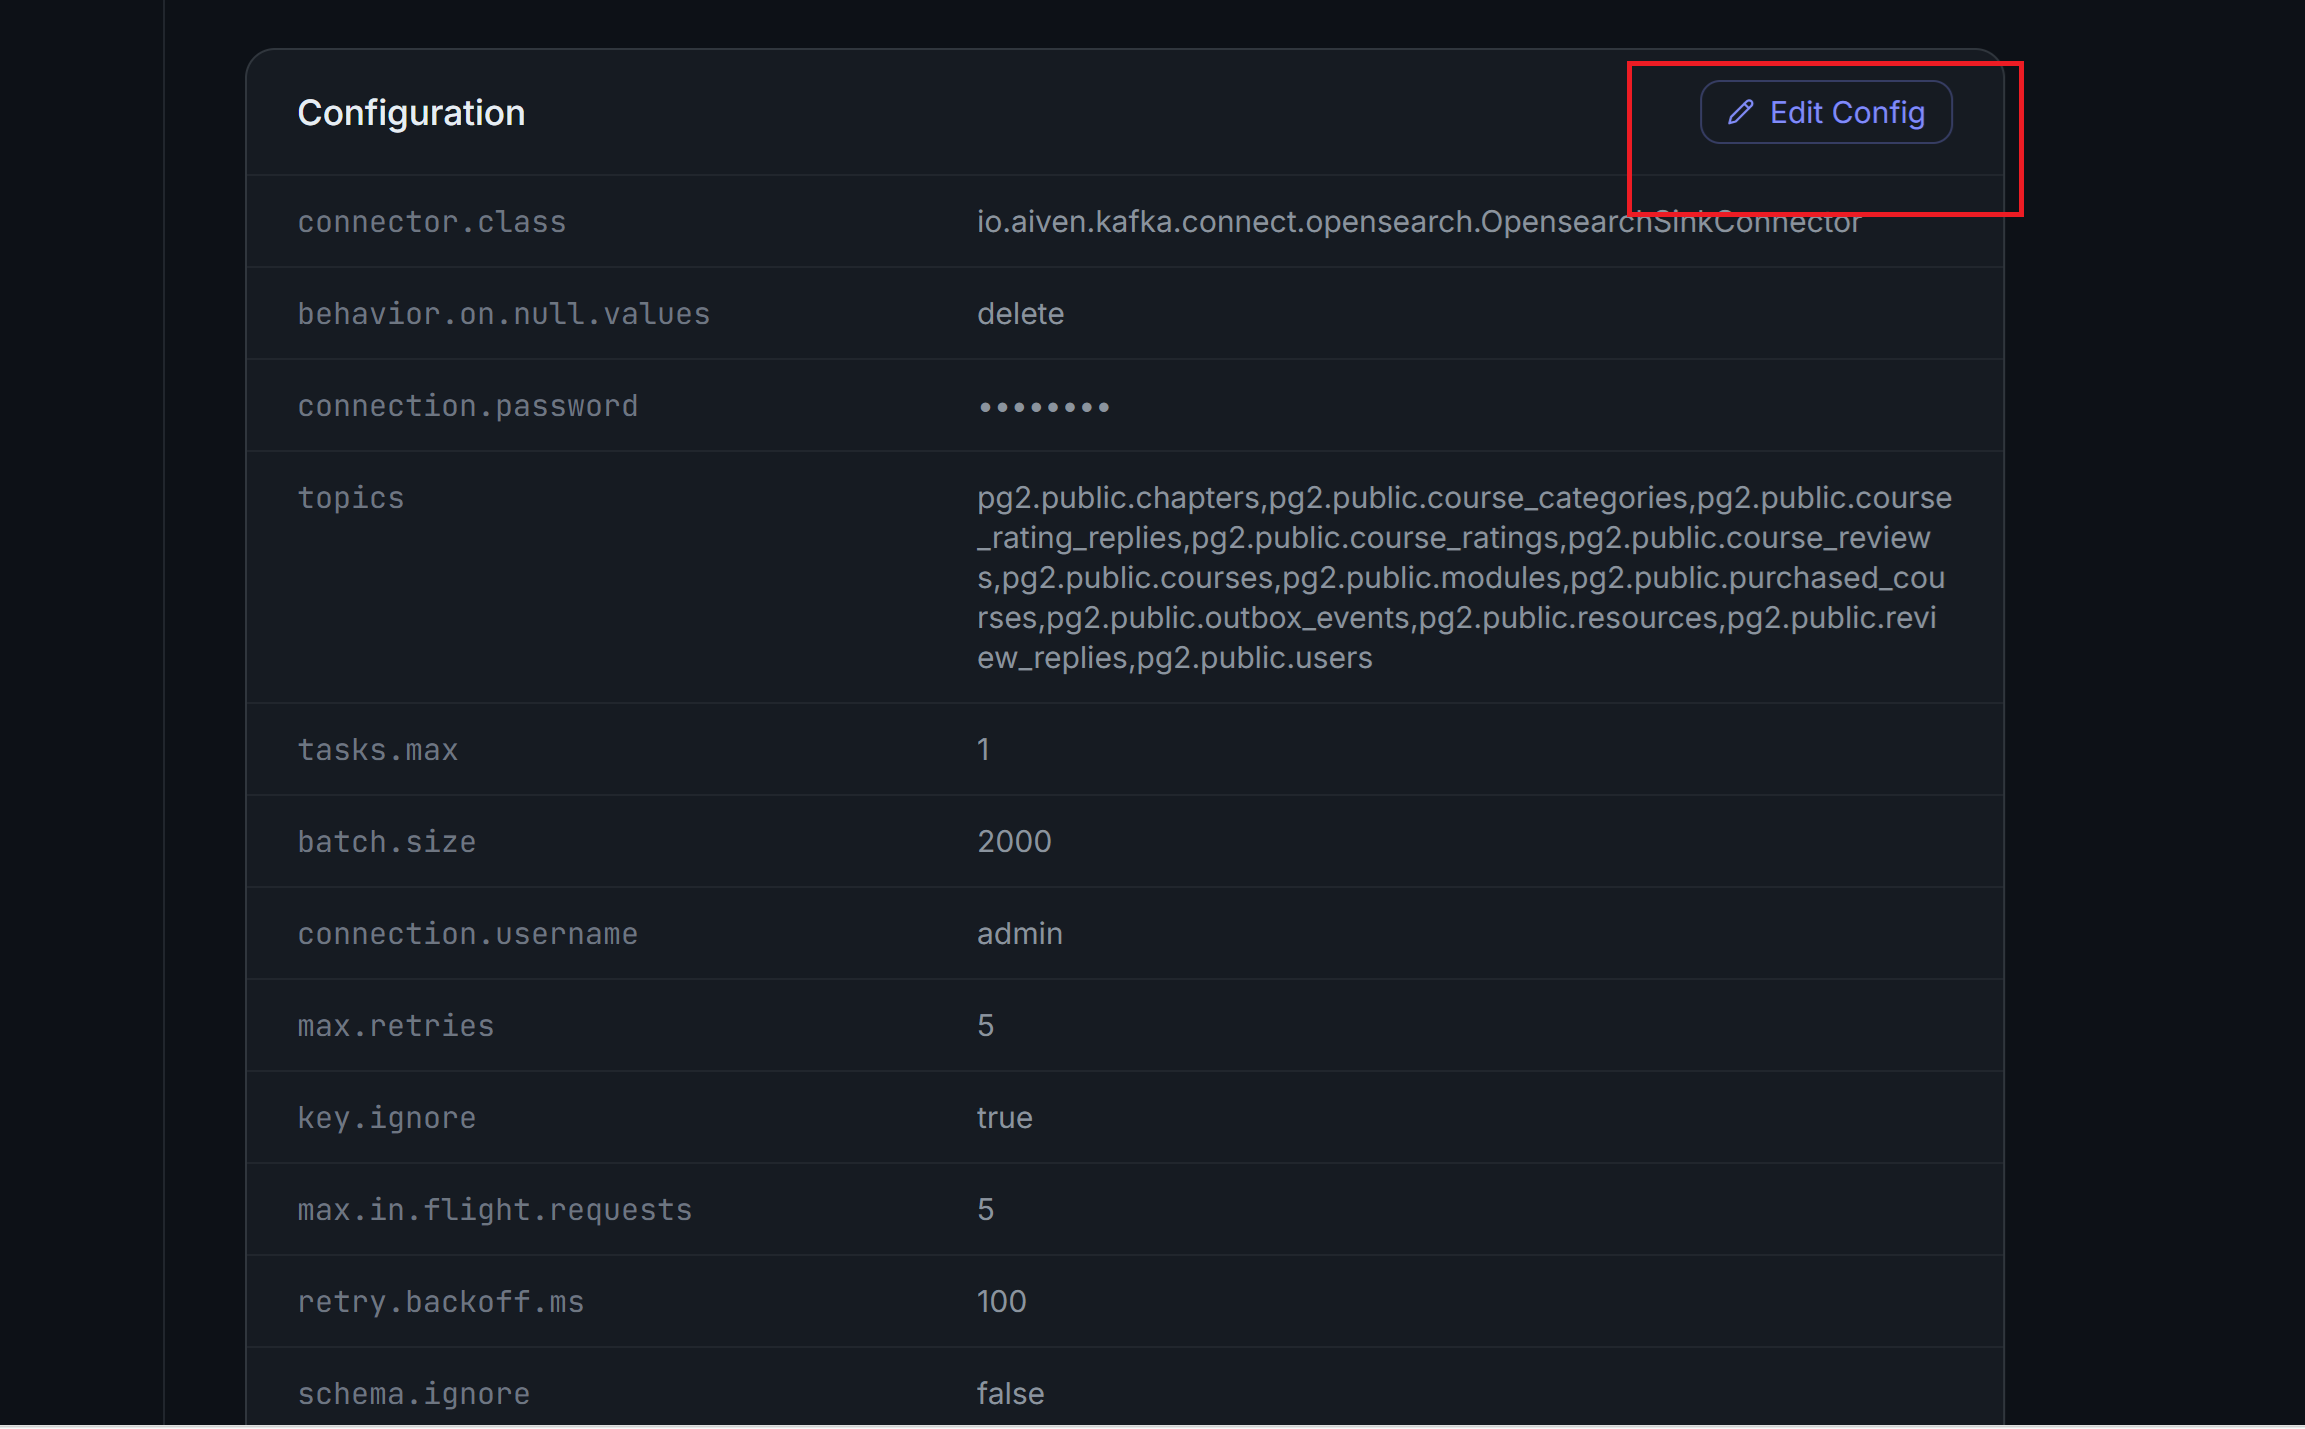
PII and Data Governance Built-In
Column-level controls: mask with asterisks, salted SHA-256 hash (pseudonymization under GDPR Article 4(5)), exclude entirely, or truncate to N characters. Rules are enforced at the Kafka Connect layer so no PII ever reaches the Kafka broker. Masking proof is persisted in config history for auditors.
- Customer email: SHA-256 hash (GDPR pseudonymization)
- Payment card PAN: truncated to last 4 digits (PCI-DSS SAQ-D)
- CVV field: excluded from the CDC stream entirely - never reaches Kafka or any downstream store via this pipeline, even if present in the source table
- Shipping address: masked across all CDC streams; raw data reaches S3 only via a separate internal pipeline that bypasses the masking layer
Compliance
04 — ZERO DATA CUSTODY
Pure Control Plane: Your Data Never Touches Our Servers
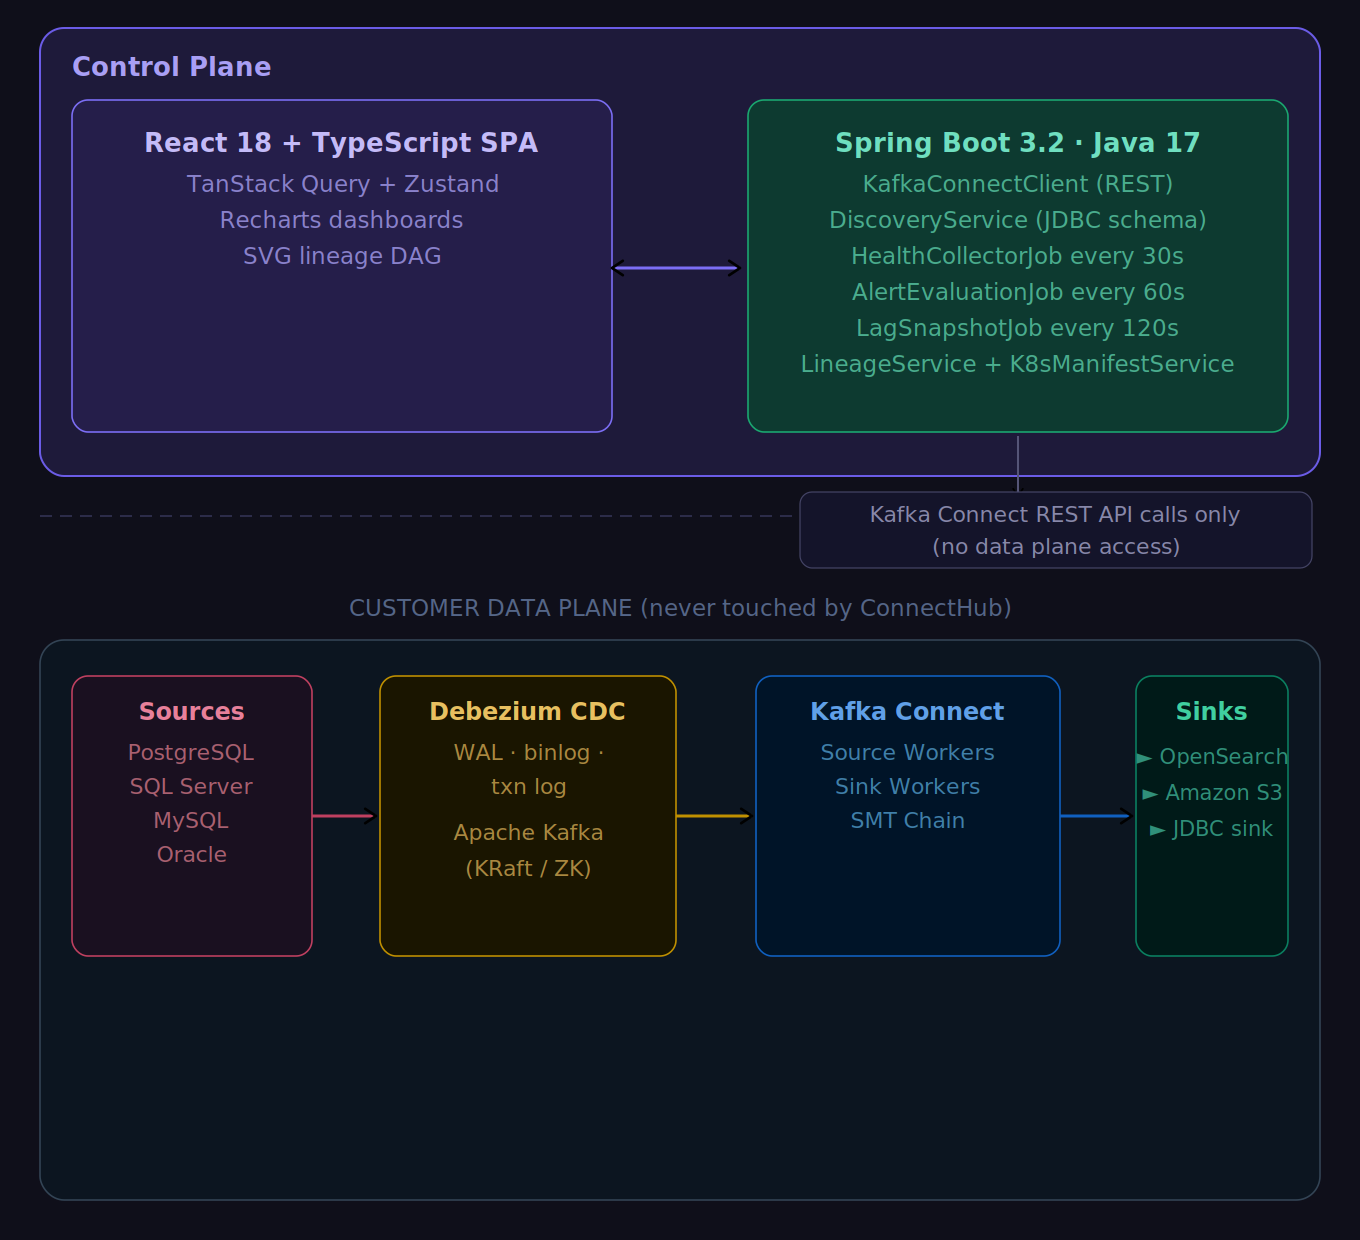
ConnectHub calls only the Kafka Connect REST API. It is not a Kafka consumer, not a JDBC proxy in production. Data flows source to broker to sink exactly as with raw connector JSON. This eliminates data sovereignty objections in financial services and healthcare.
Security
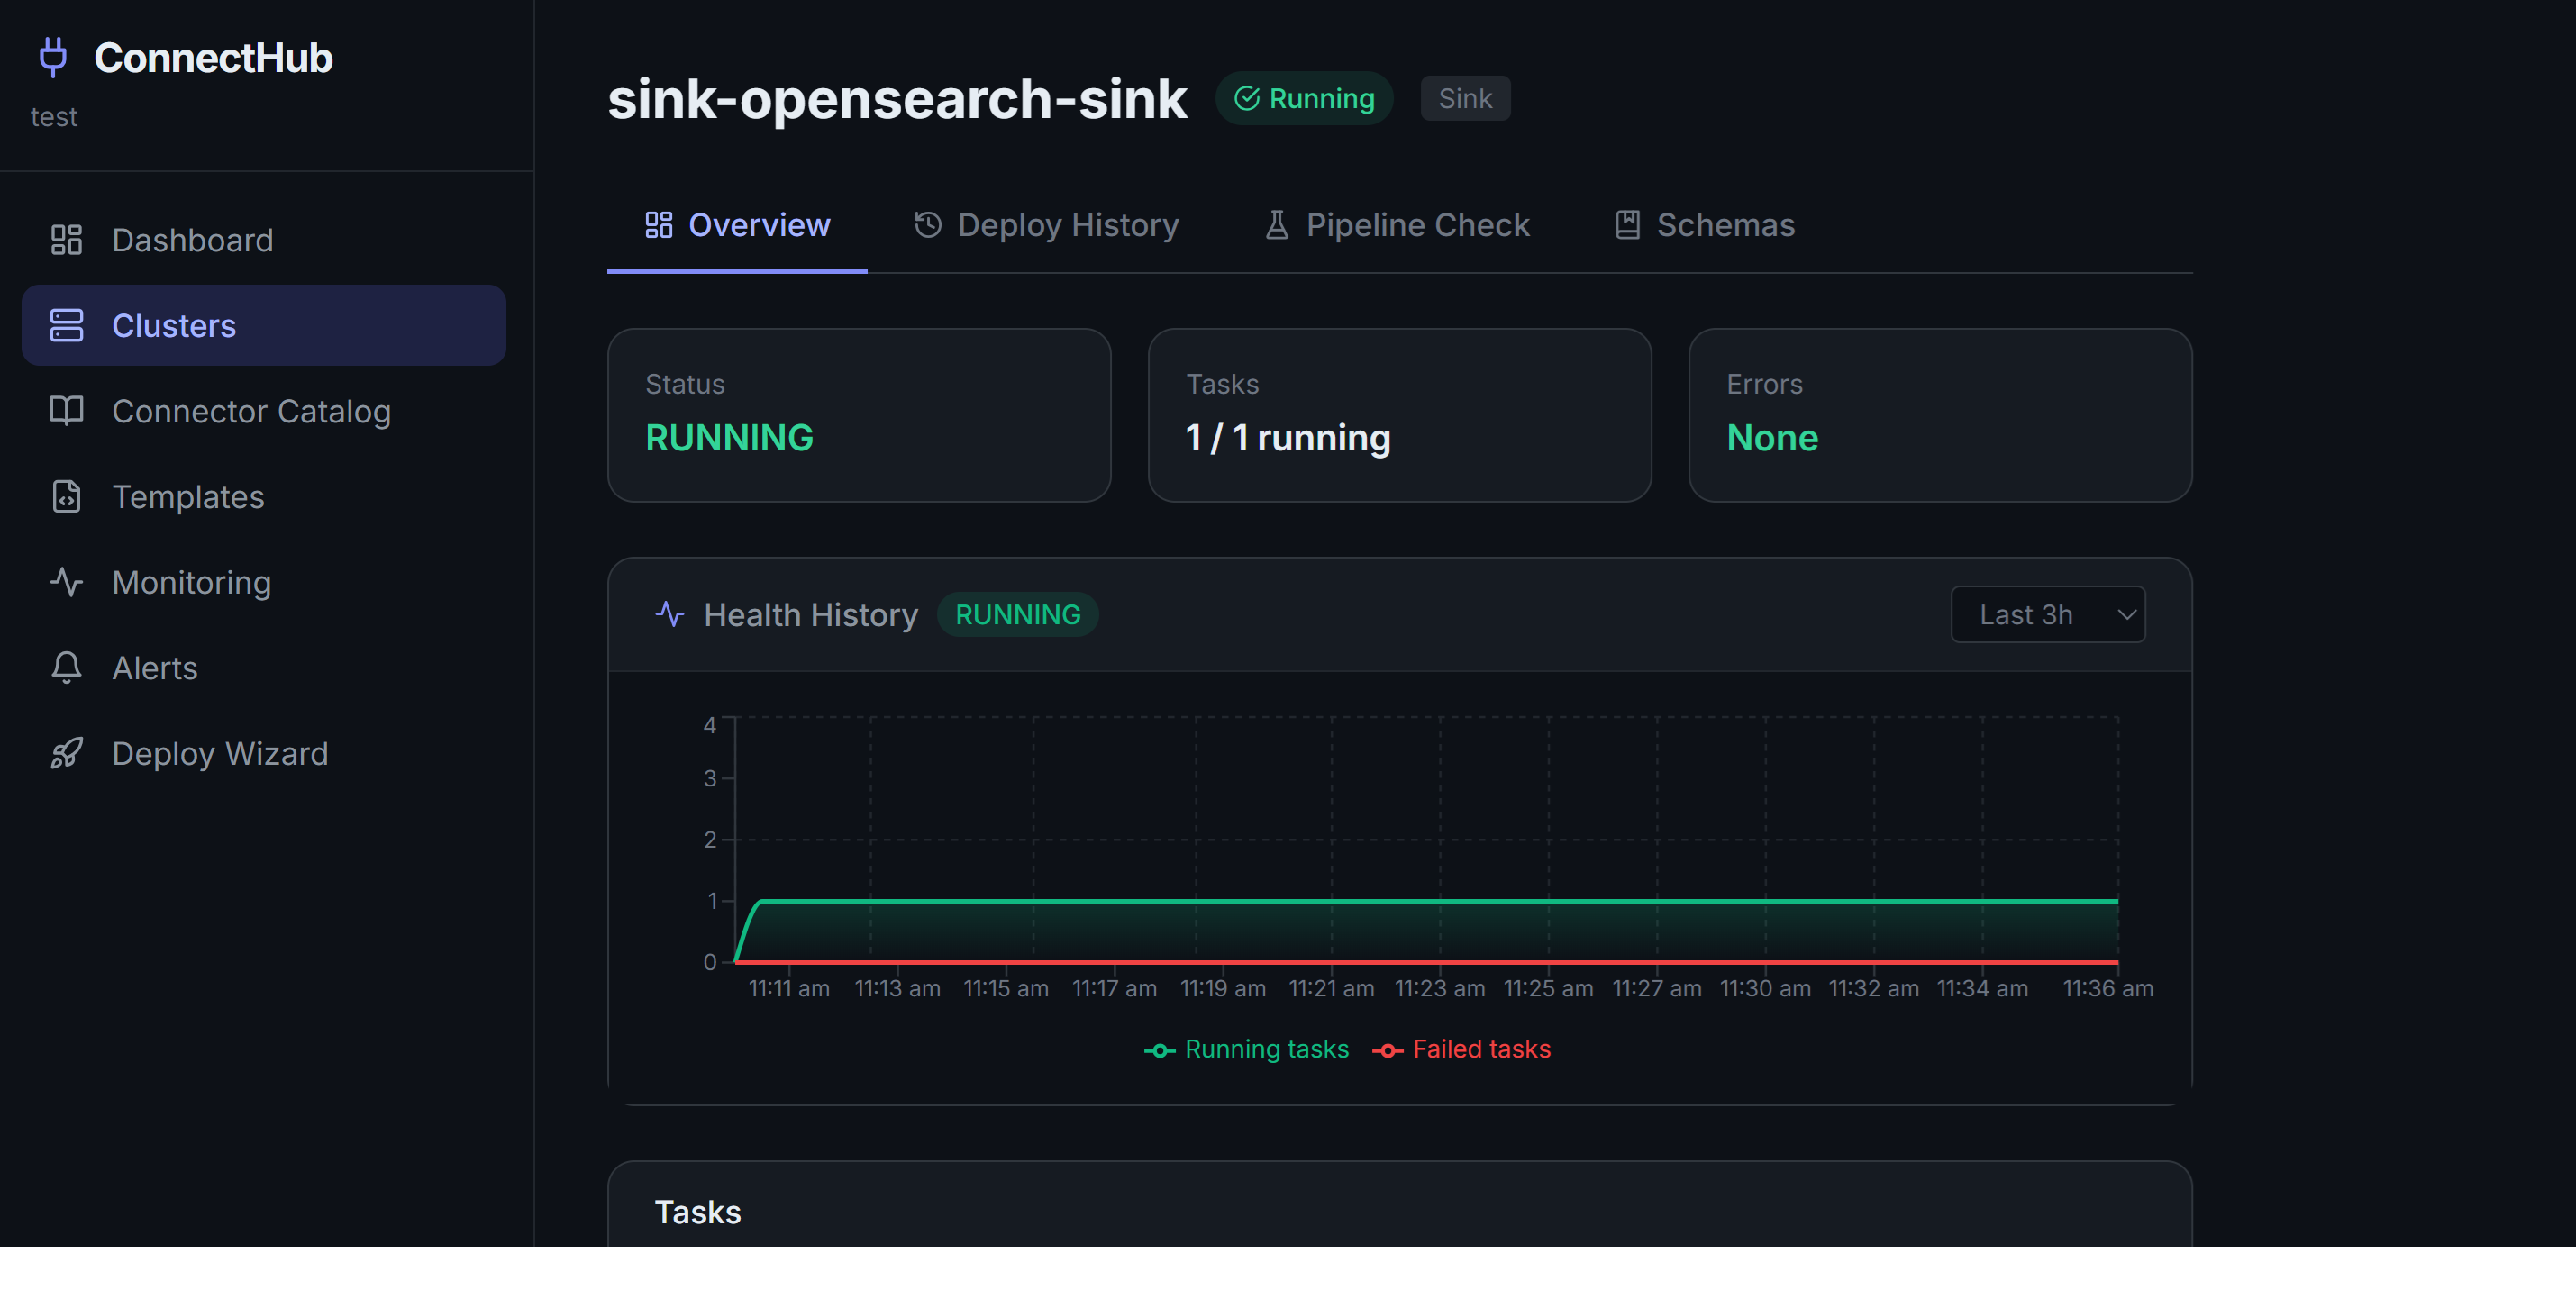
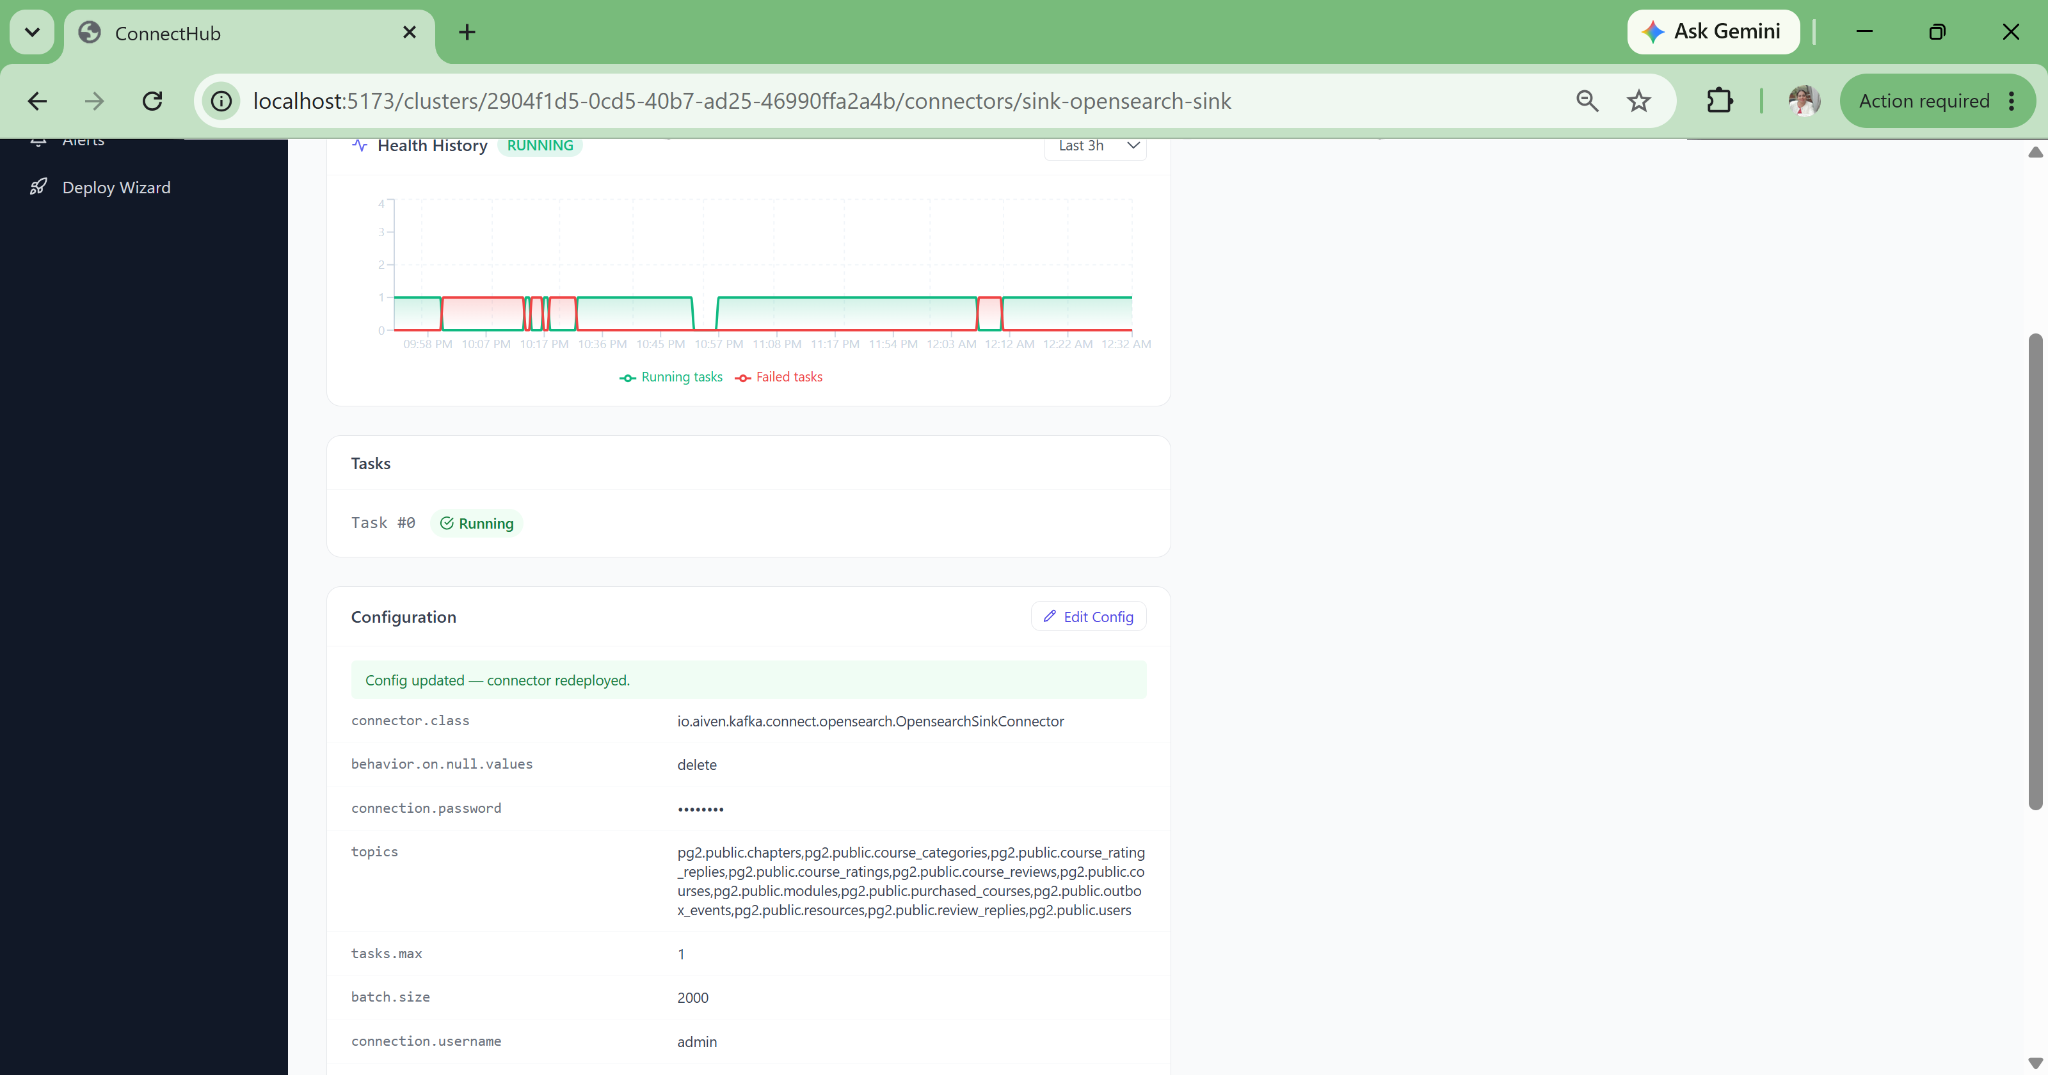
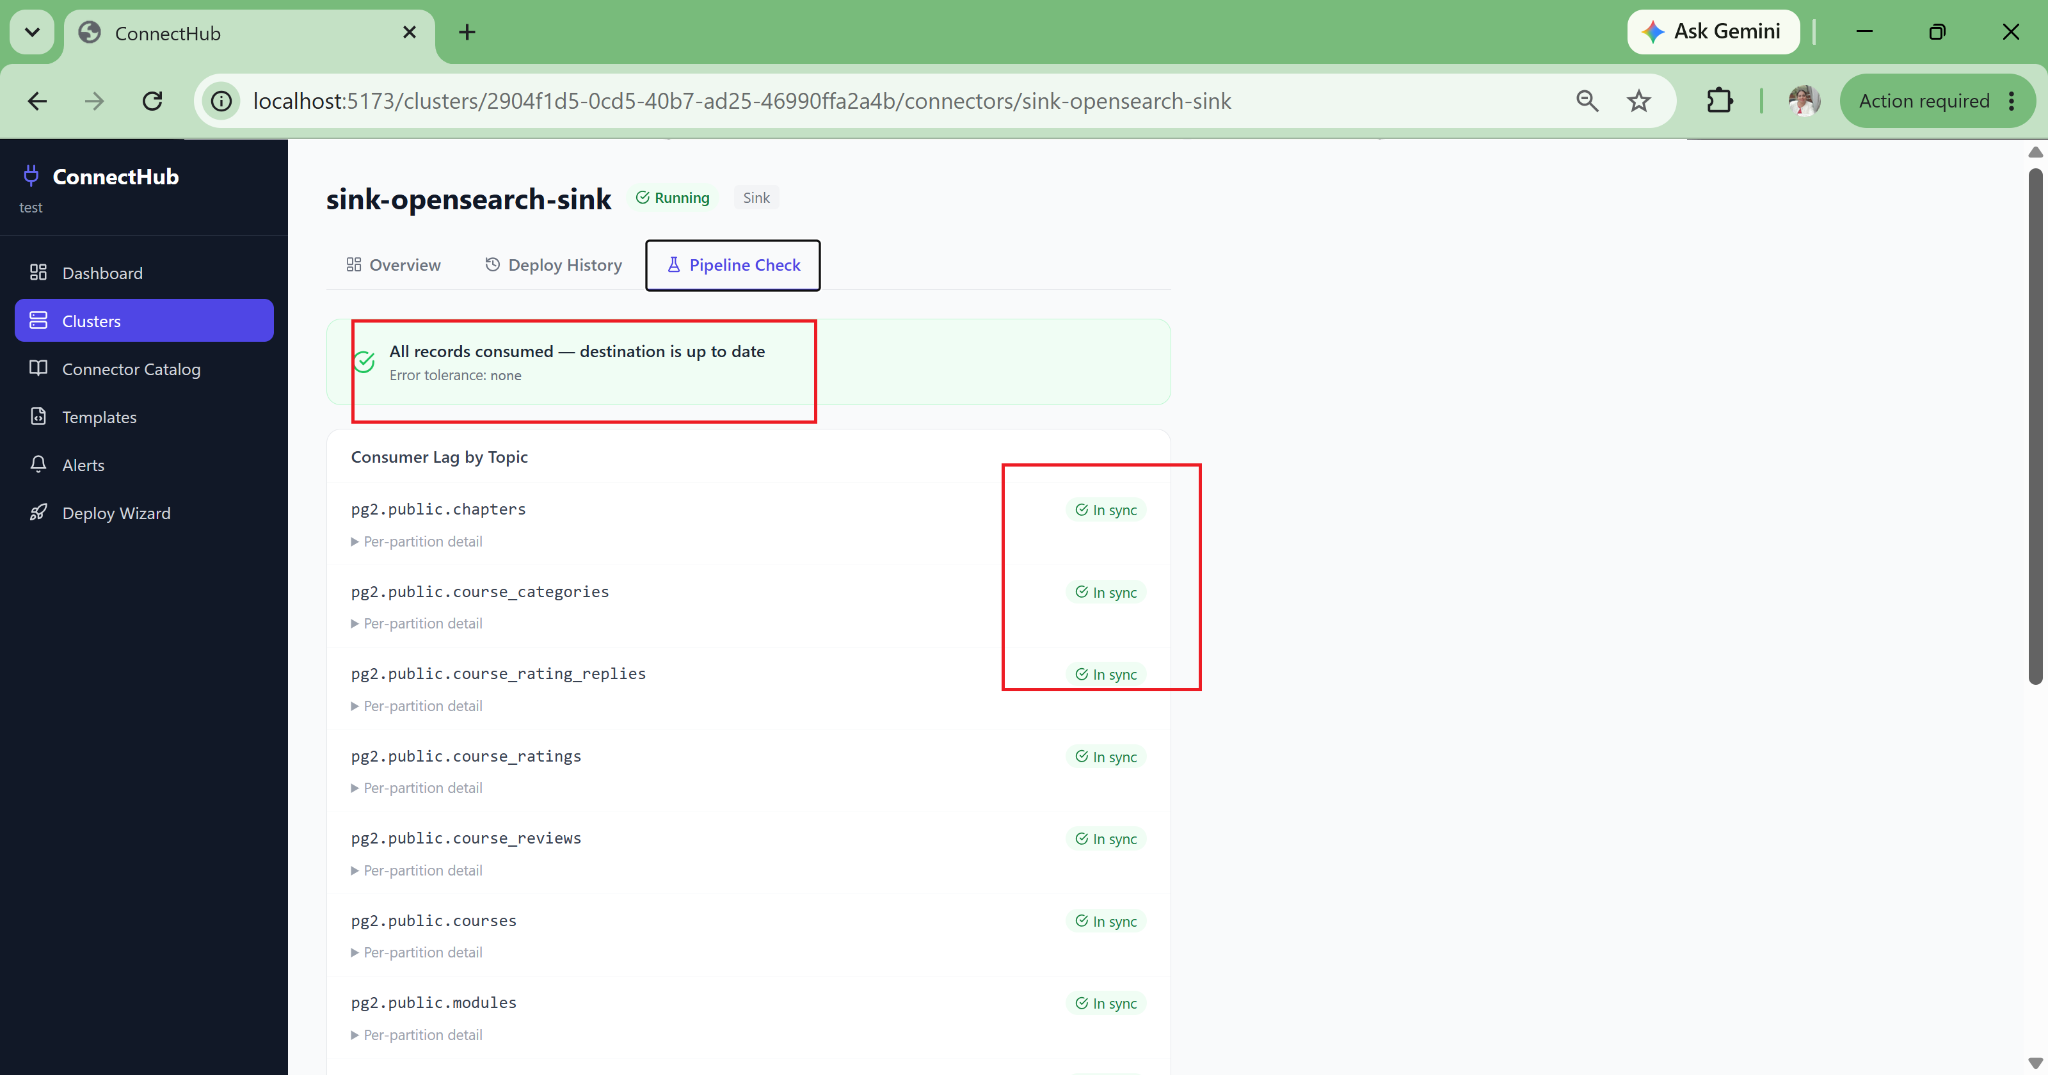
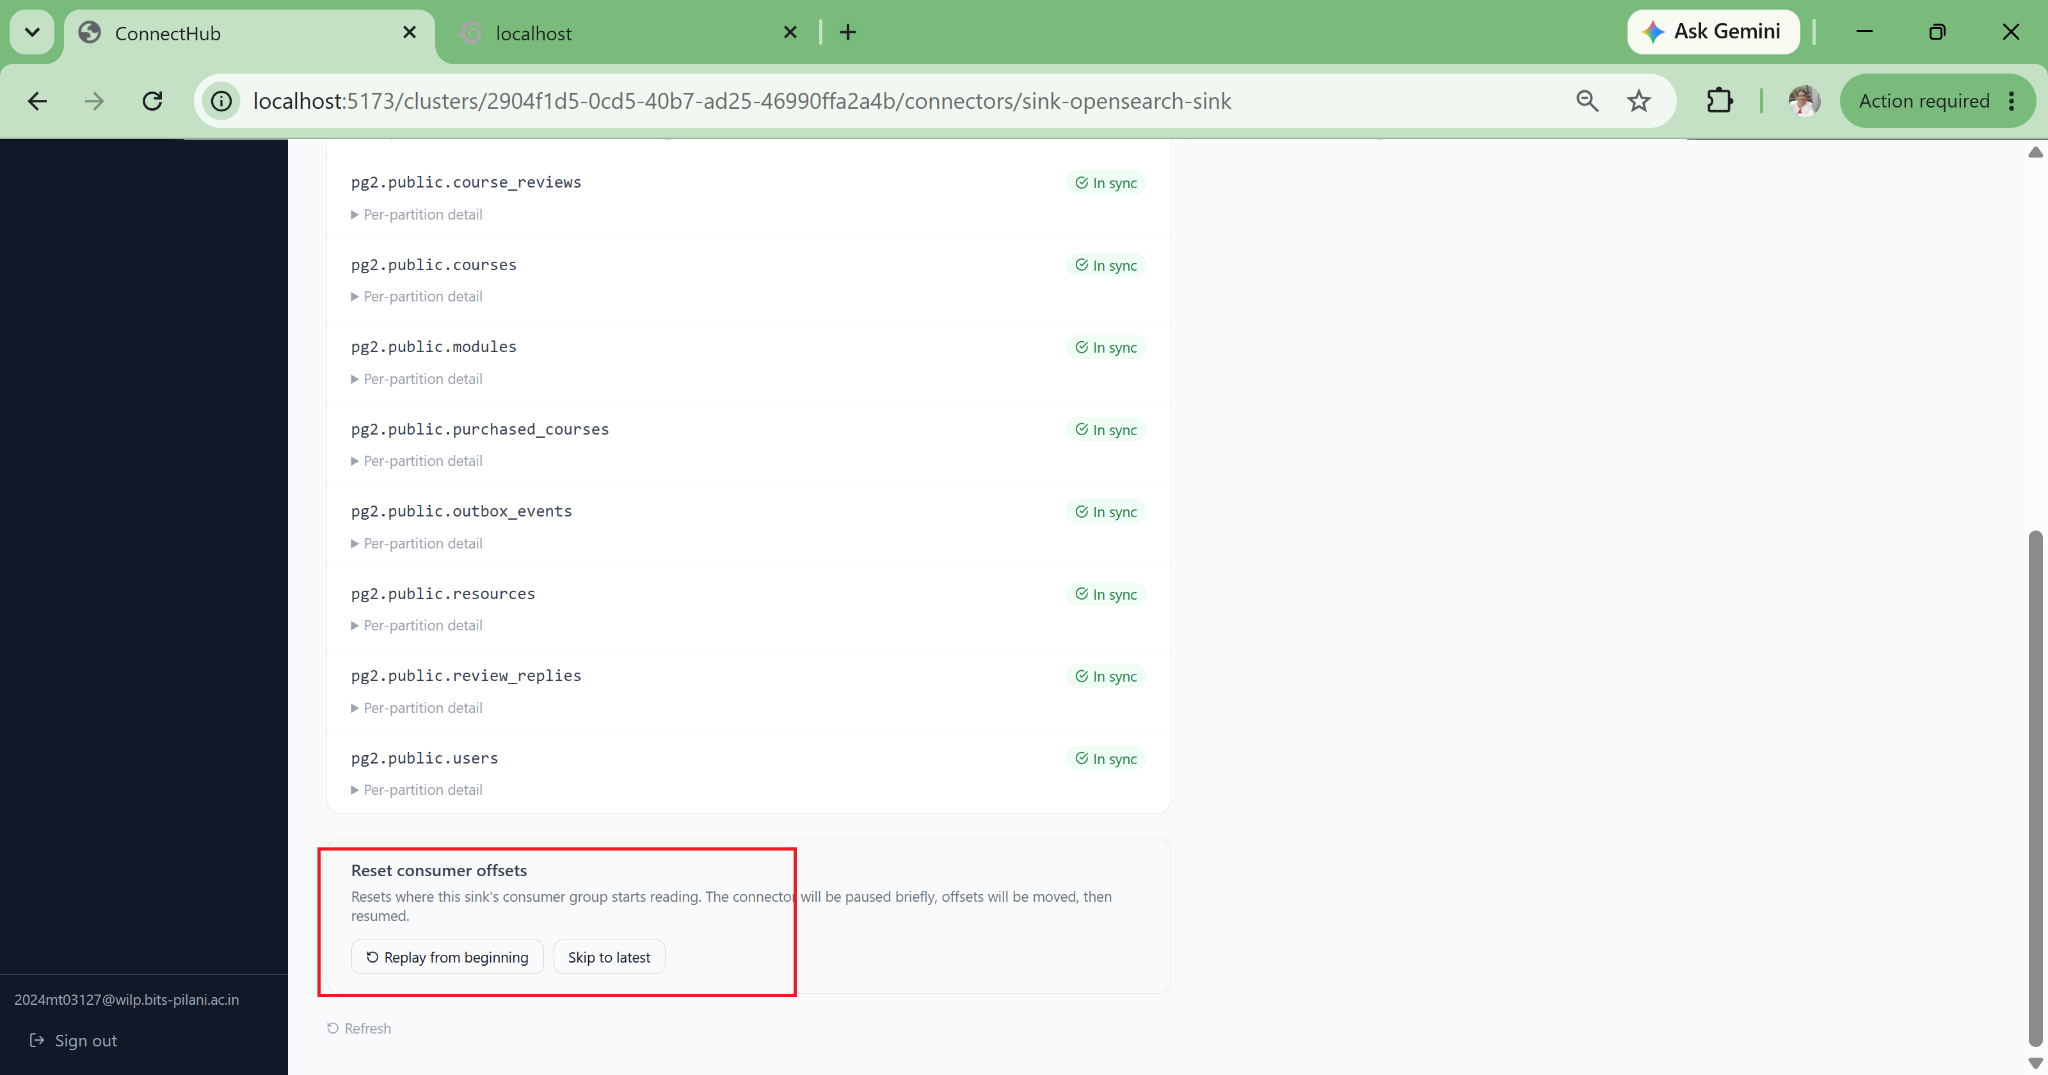
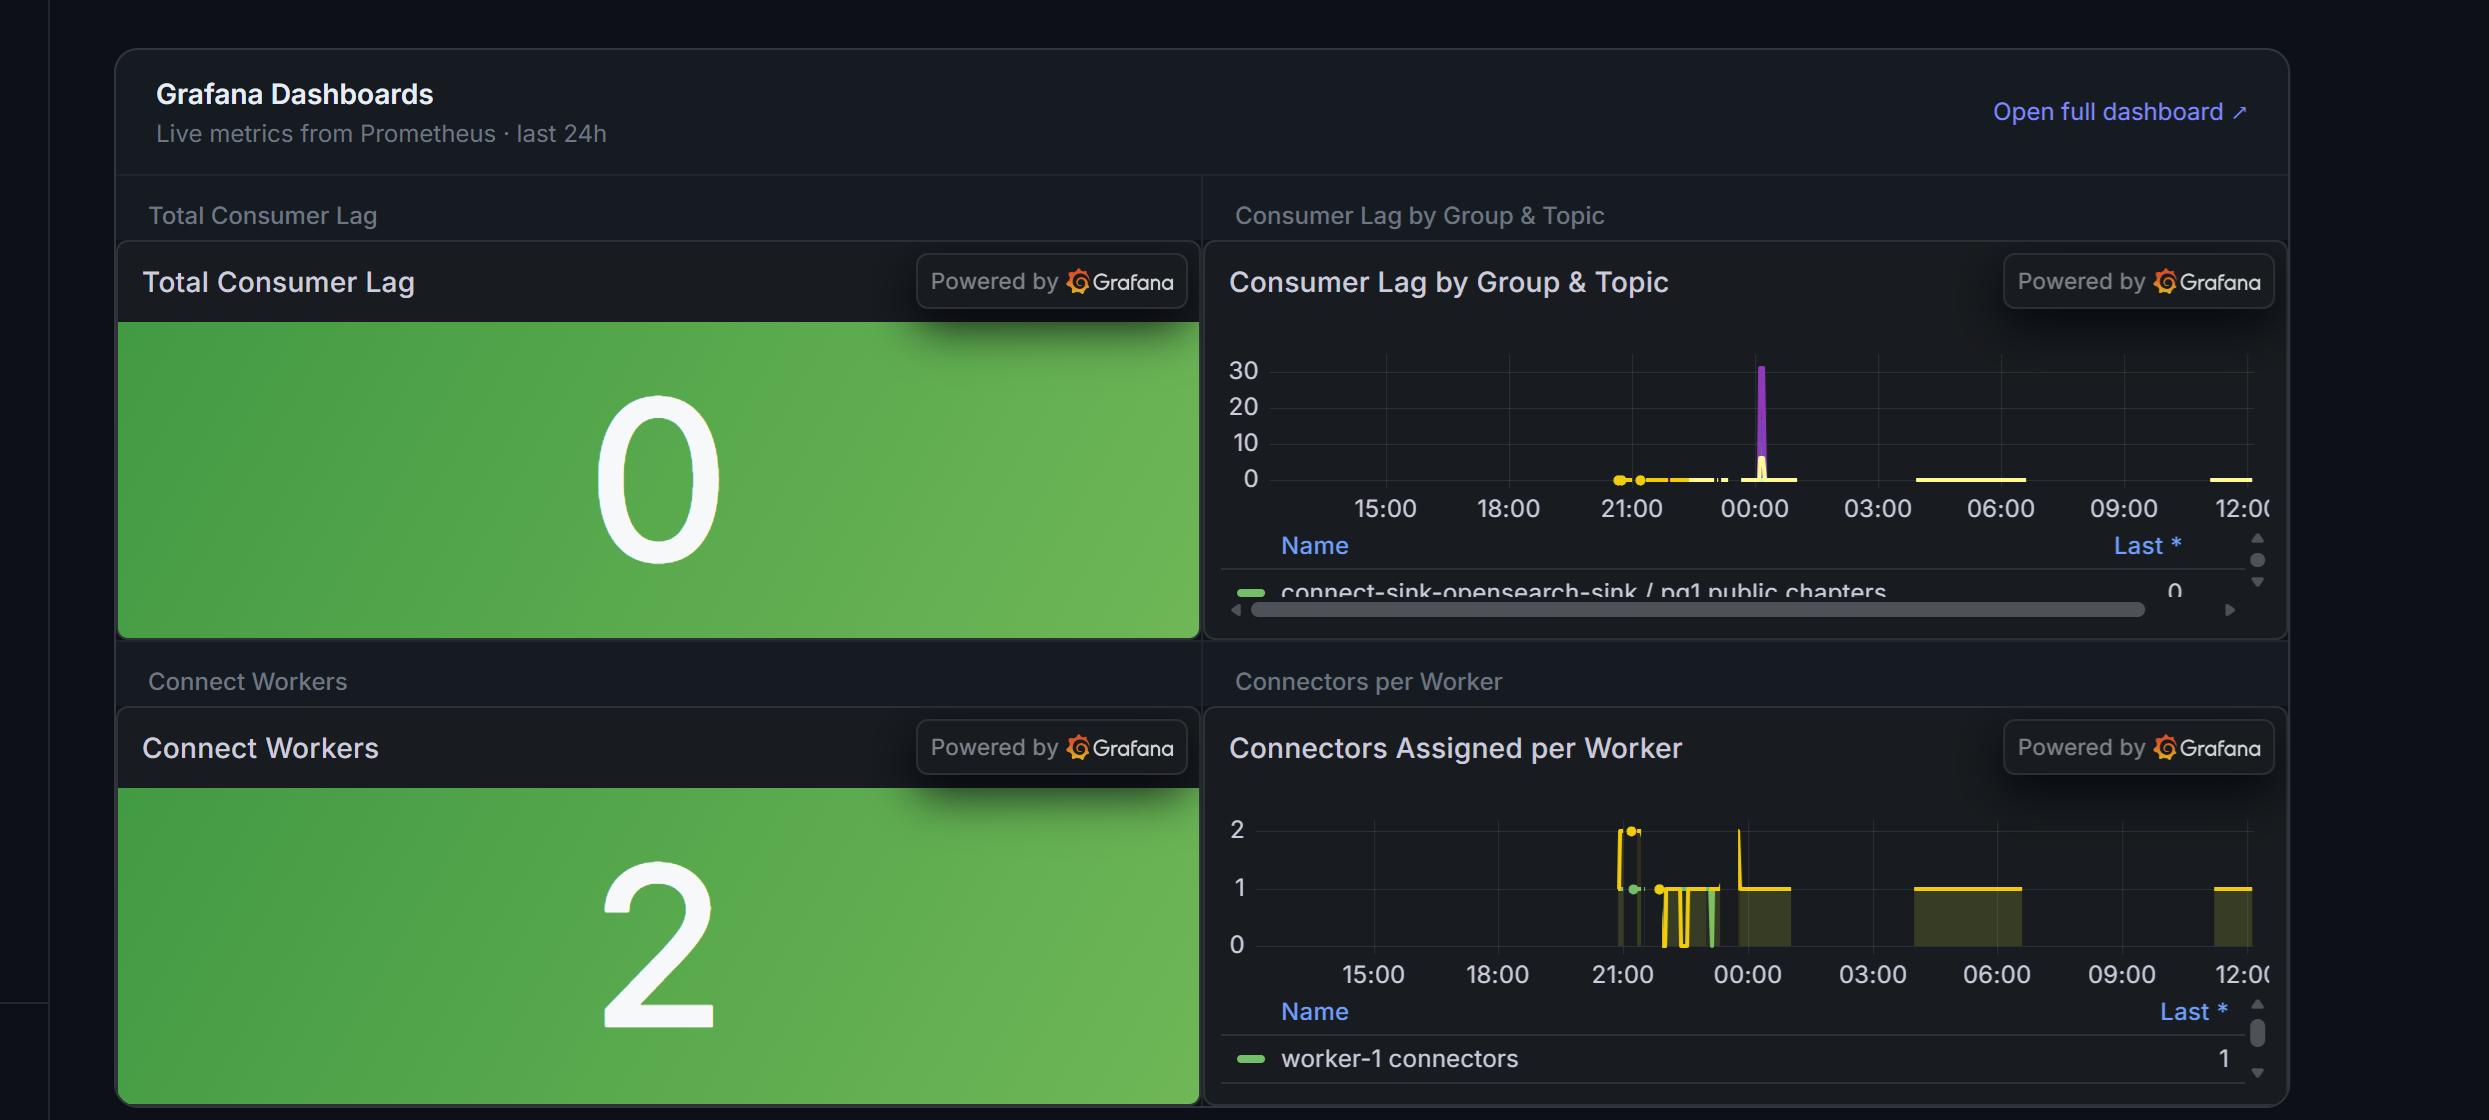
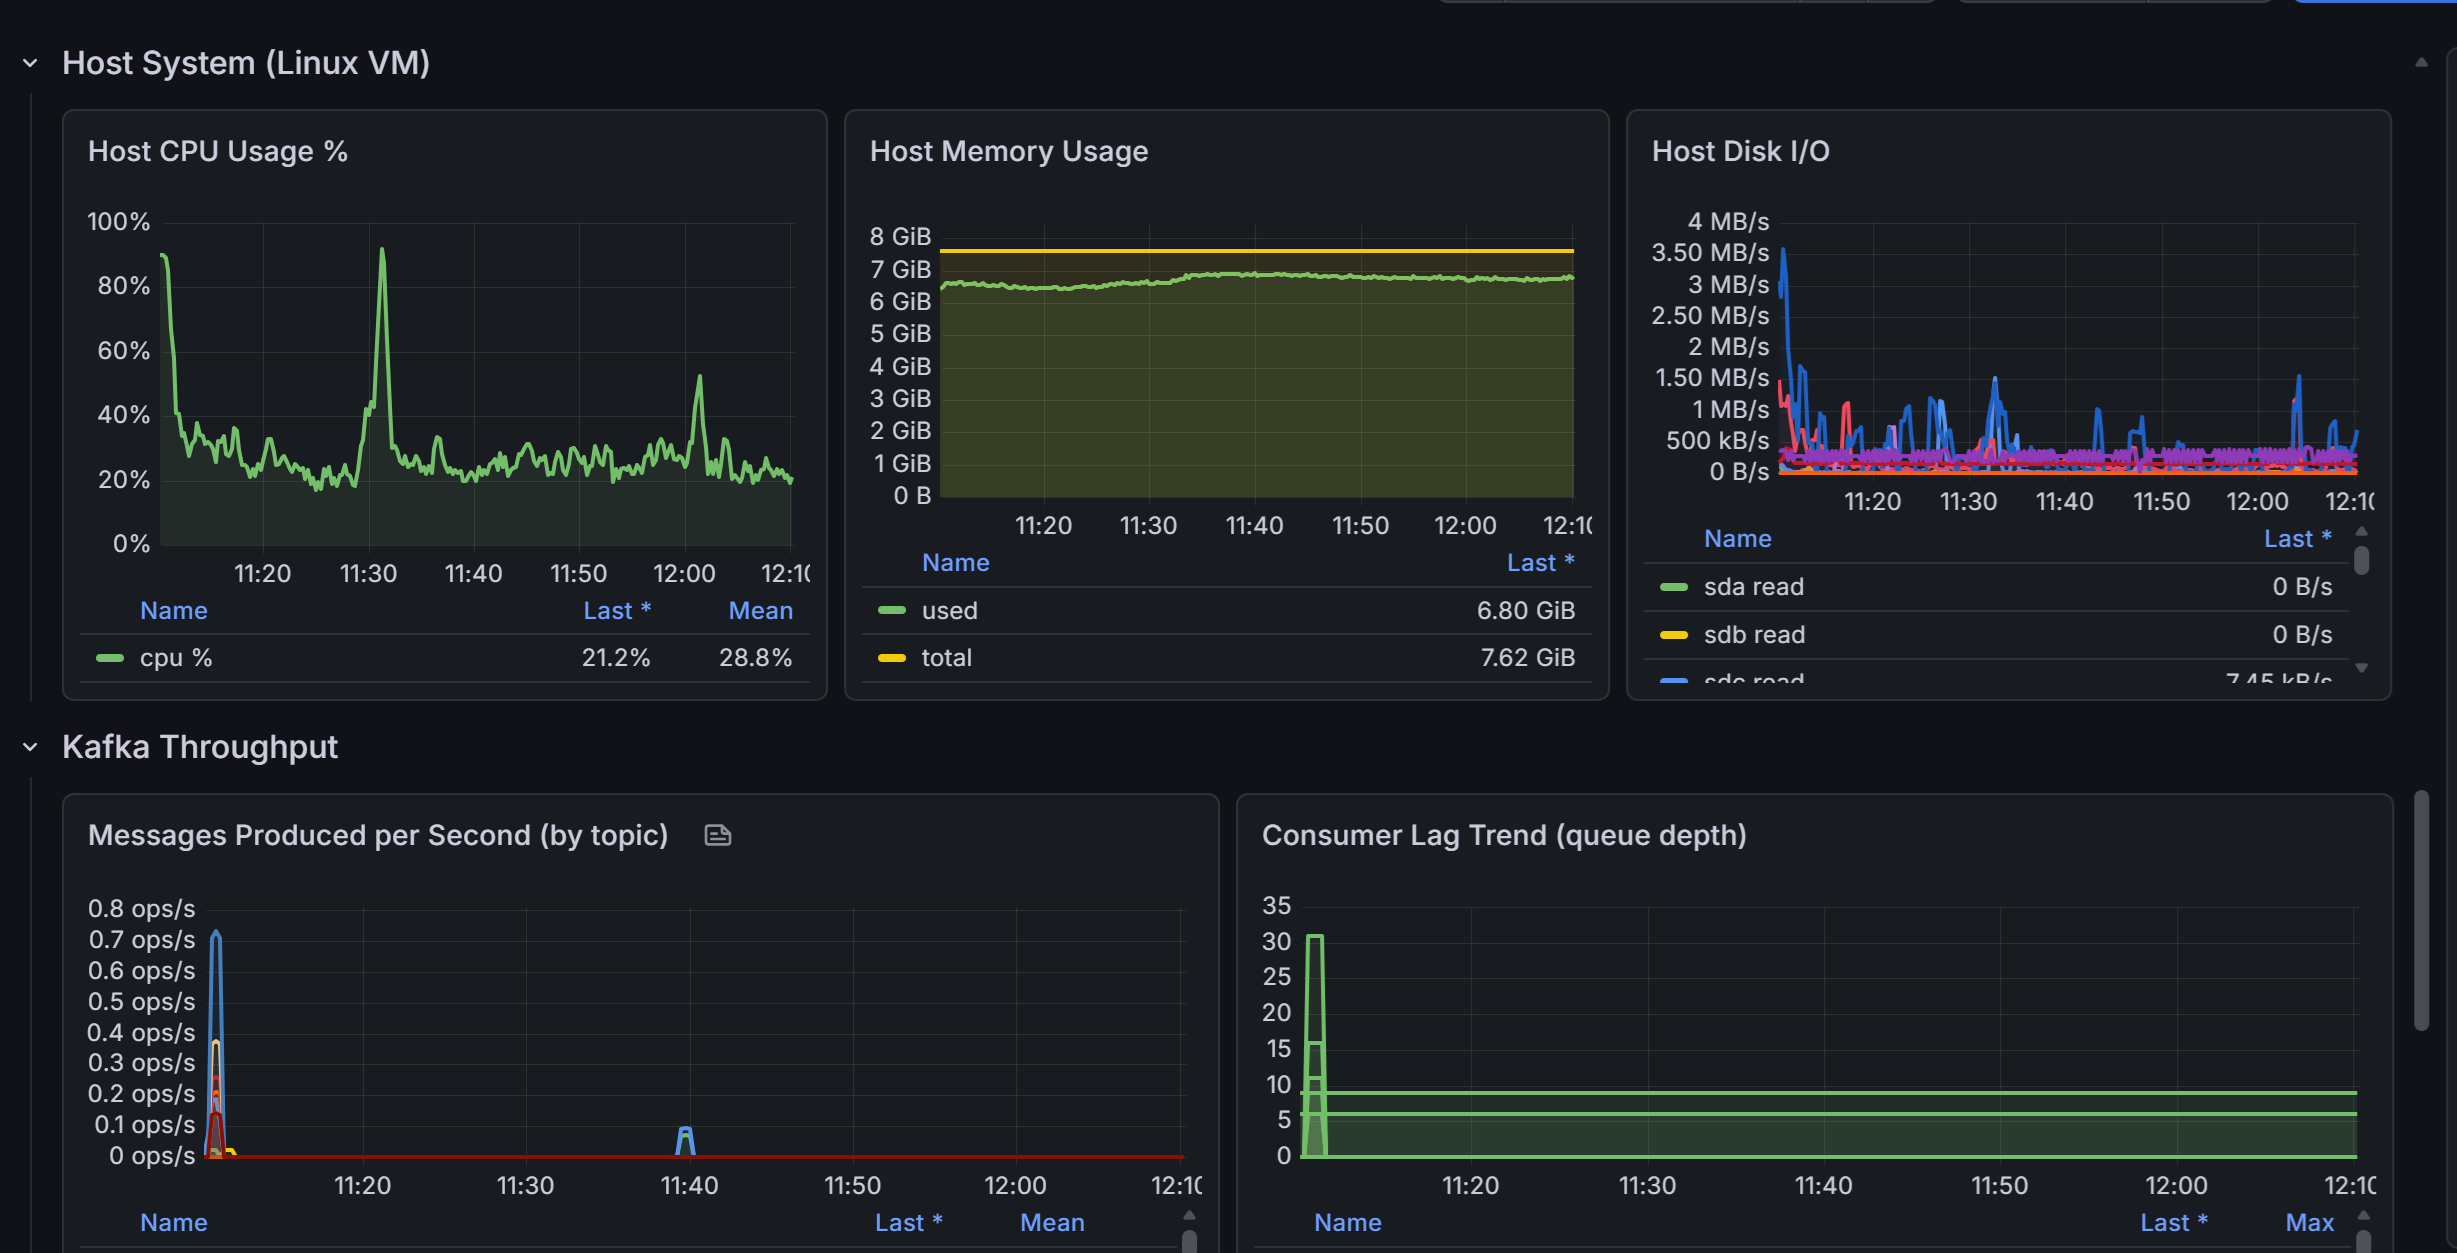
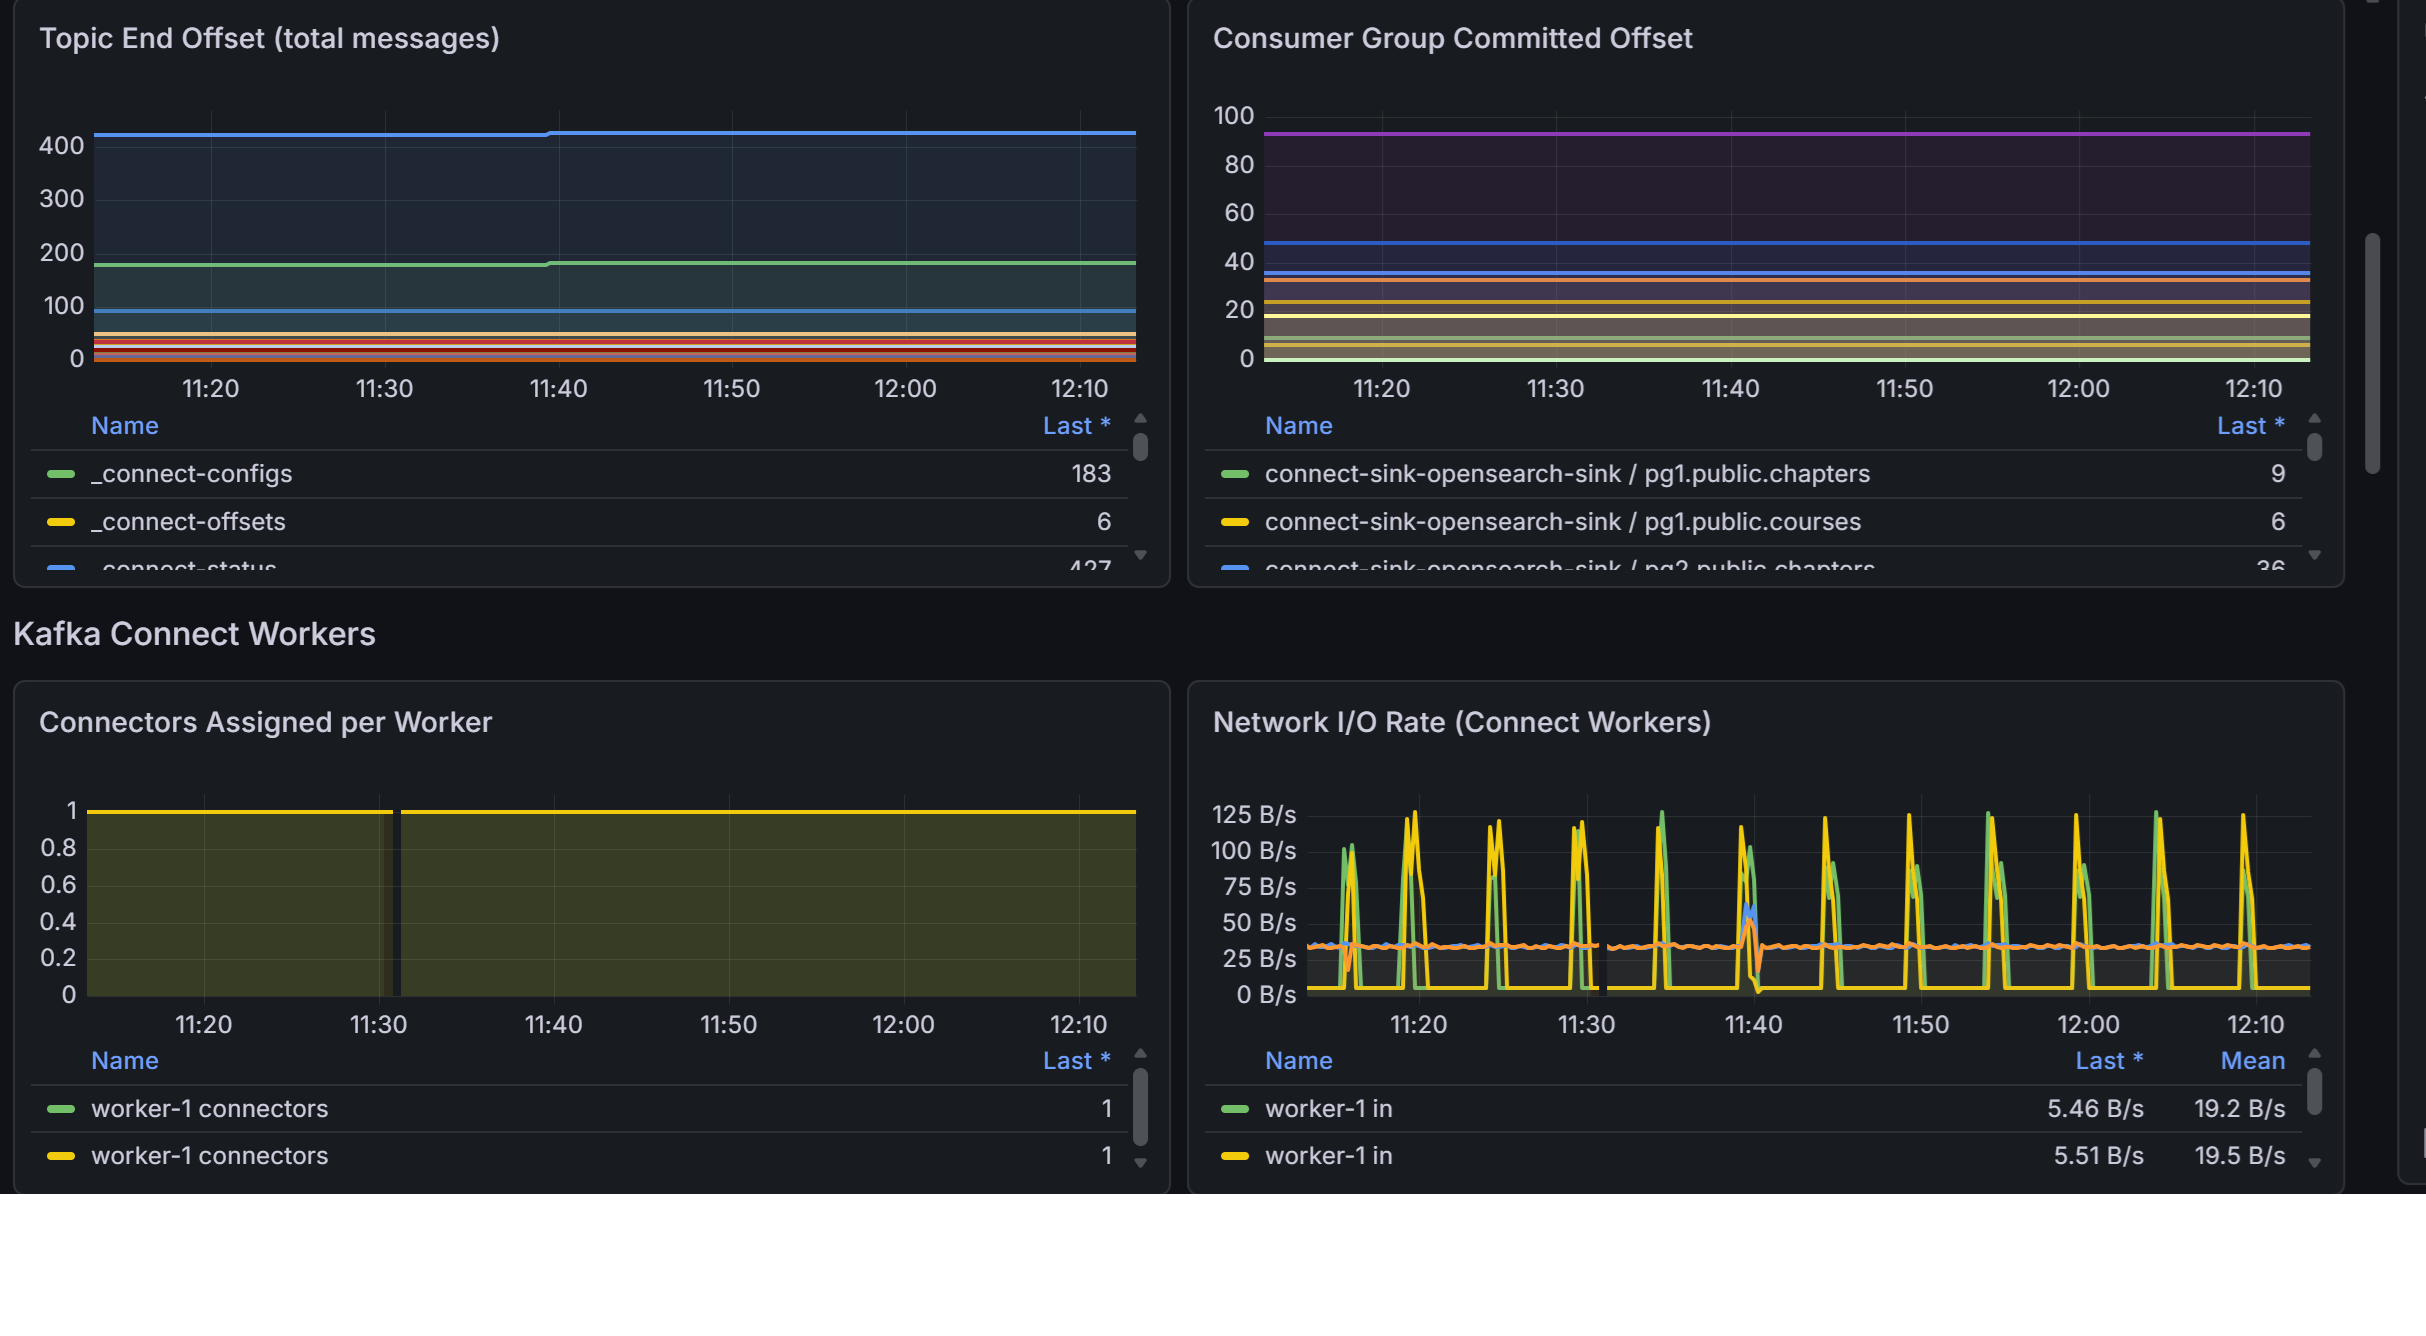
05 — OBSERVABILITY
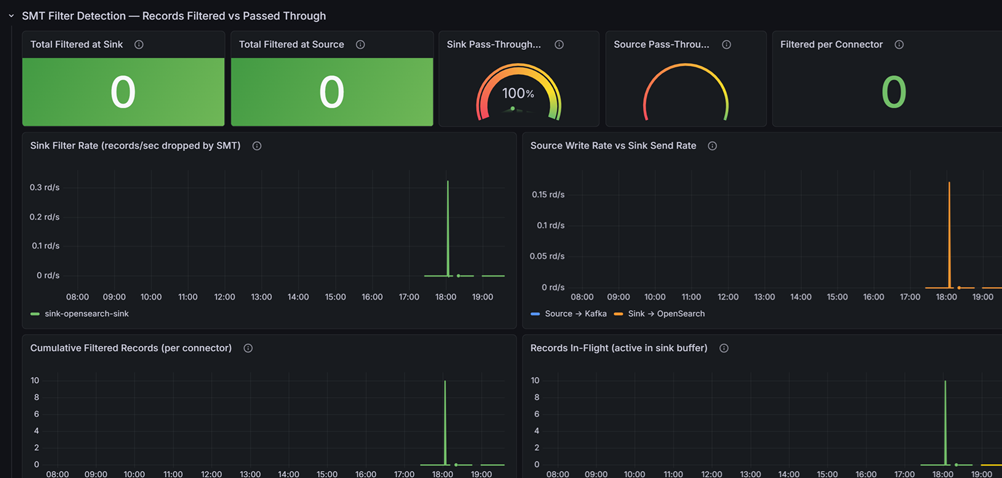
Silent Failure Detection
Pipeline Health Check surfaces what the standard Kafka Connect UI hides: DLQ accumulation, consumer lag per partition, tables with zero messages (snapshot gap), error tolerance misconfigurations, schema mismatches, and auth failures, all categorised in plain language.
Operations
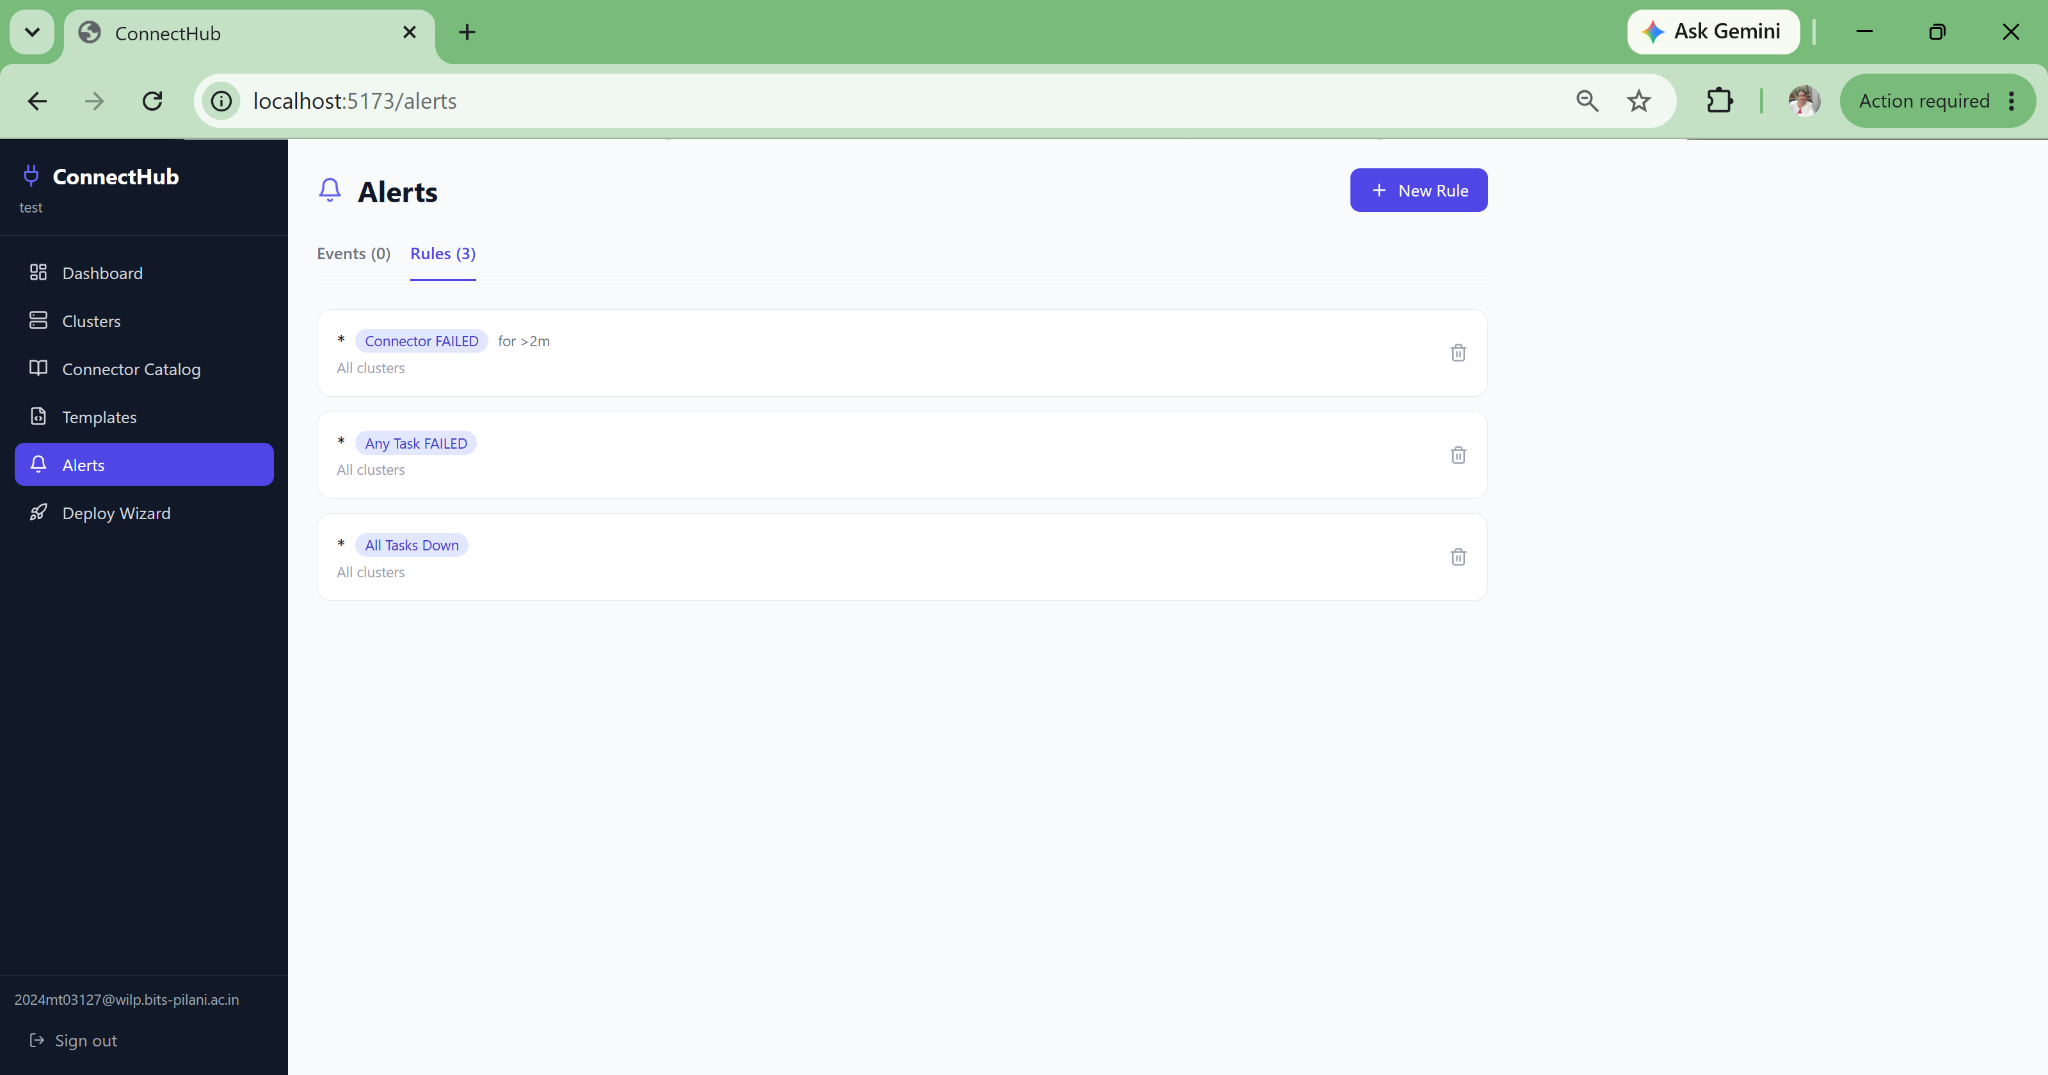
06 — ALERTING
Webhook Alerting with Auto-Resolve
Alert rules scoped to connector name patterns using regex. Configurable duration threshold prevents noise from transient restarts. Webhooks to PagerDuty, Slack, OpsGenie, or custom endpoints. Auto-resolves when the condition clears. Full event history for post-mortems.
Operations
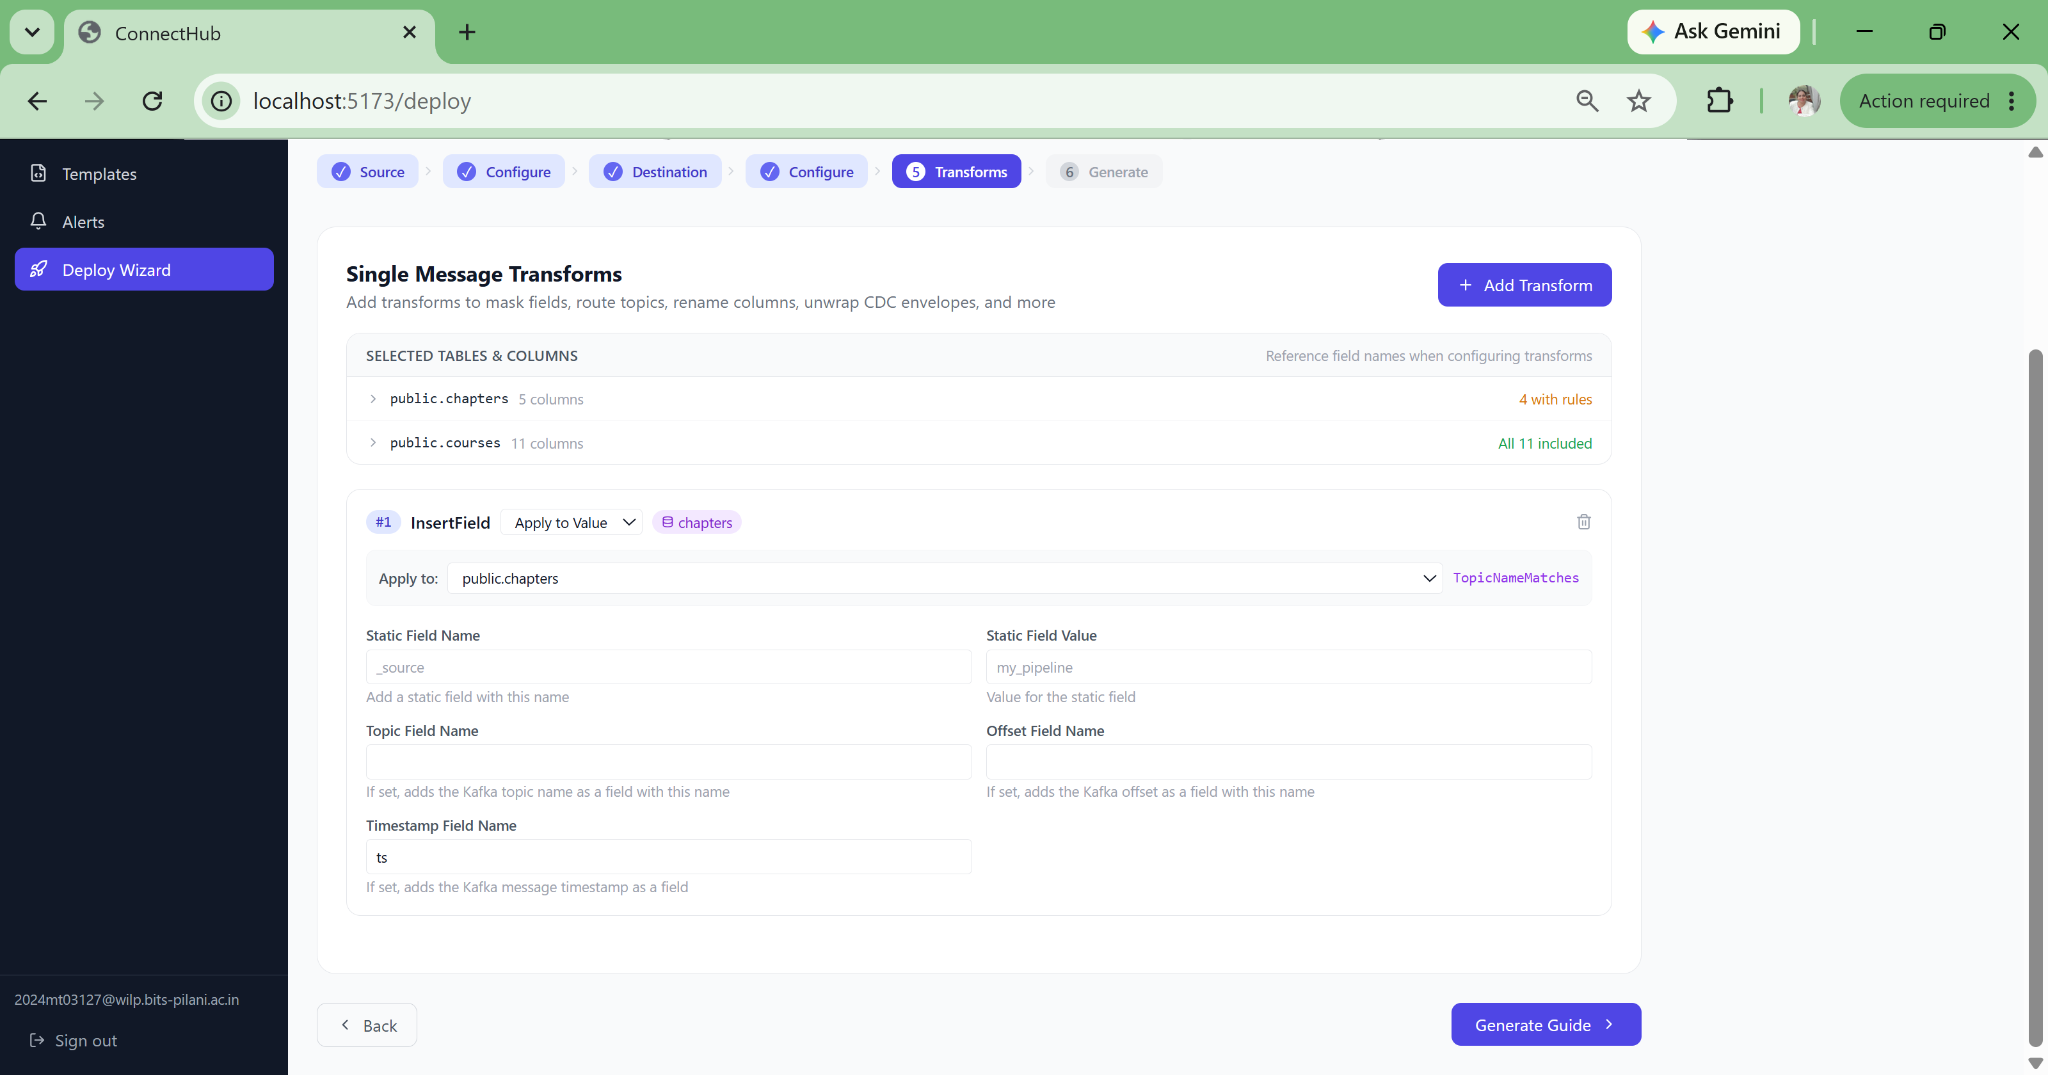
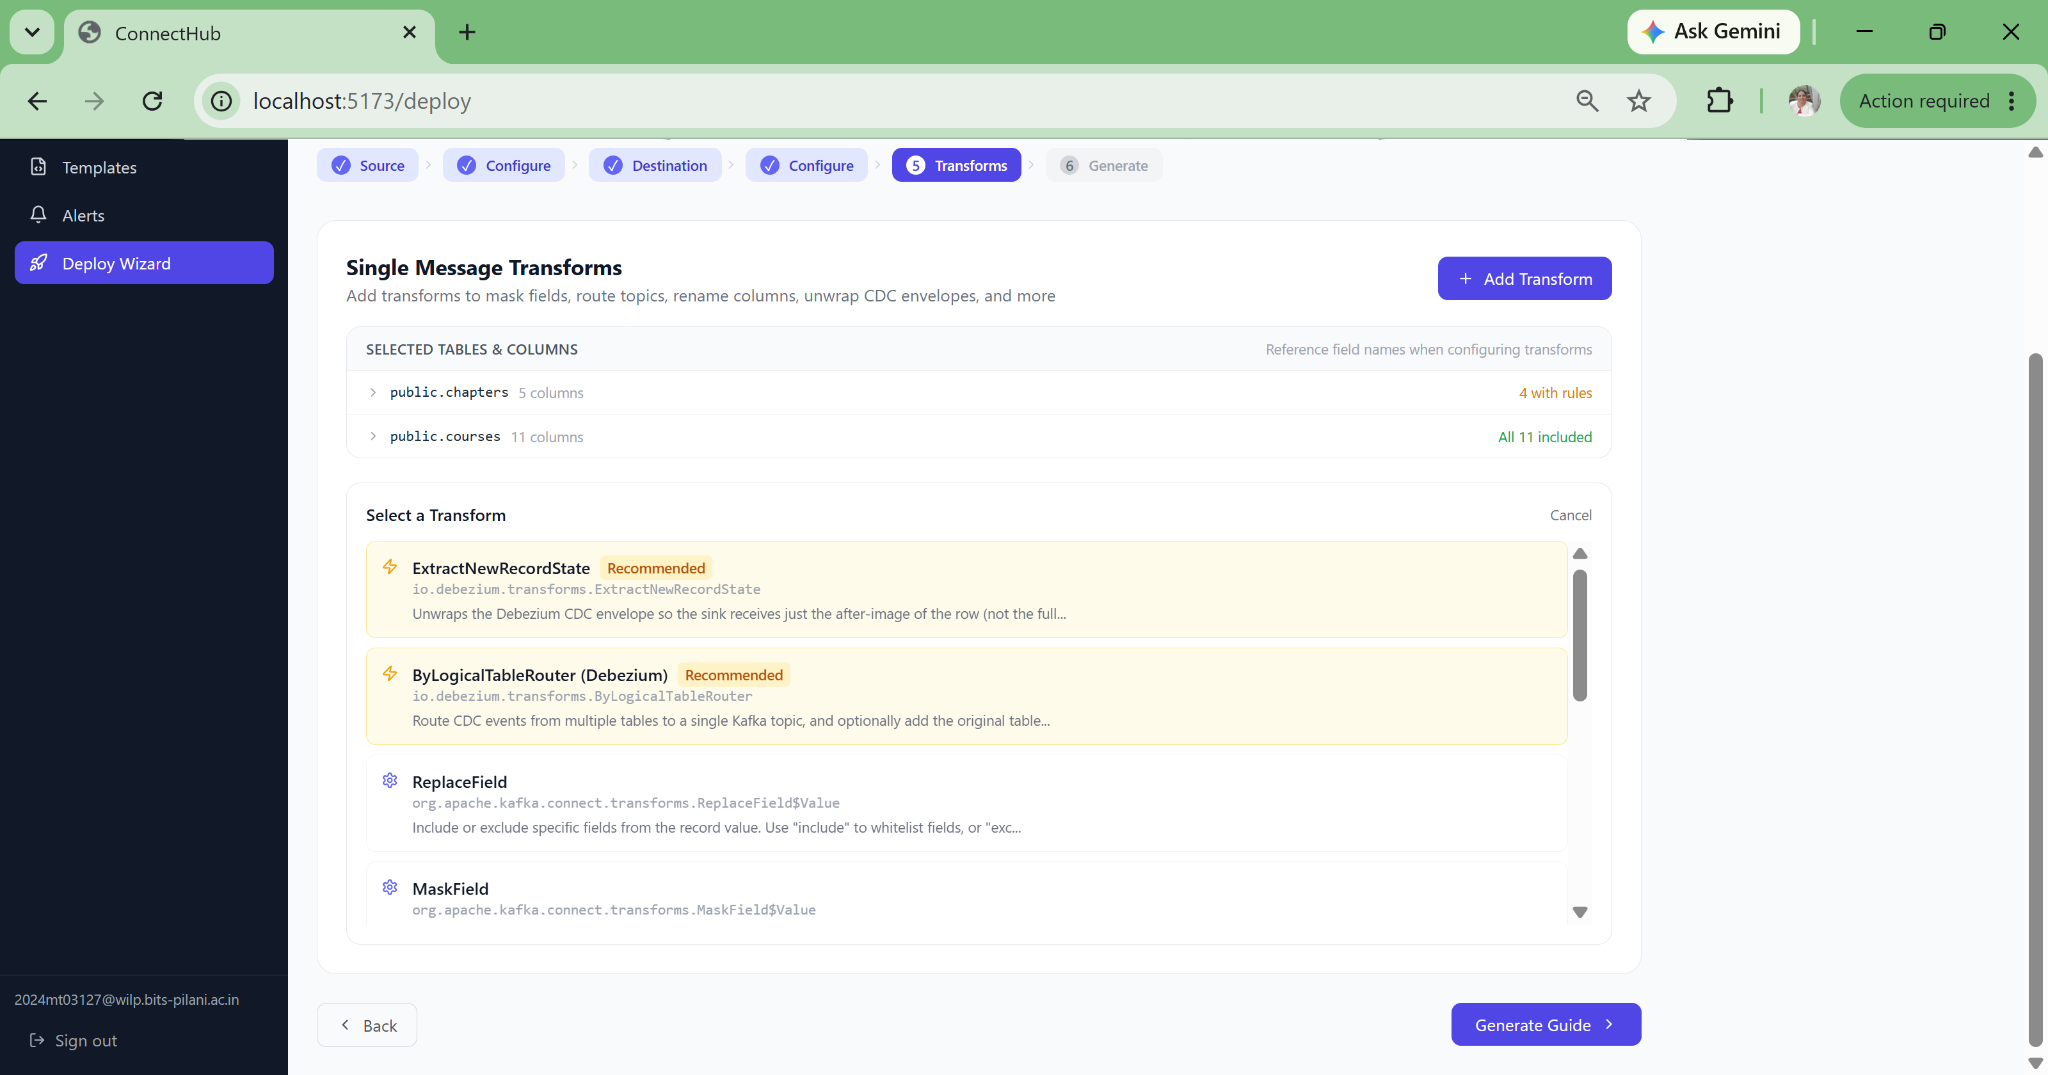
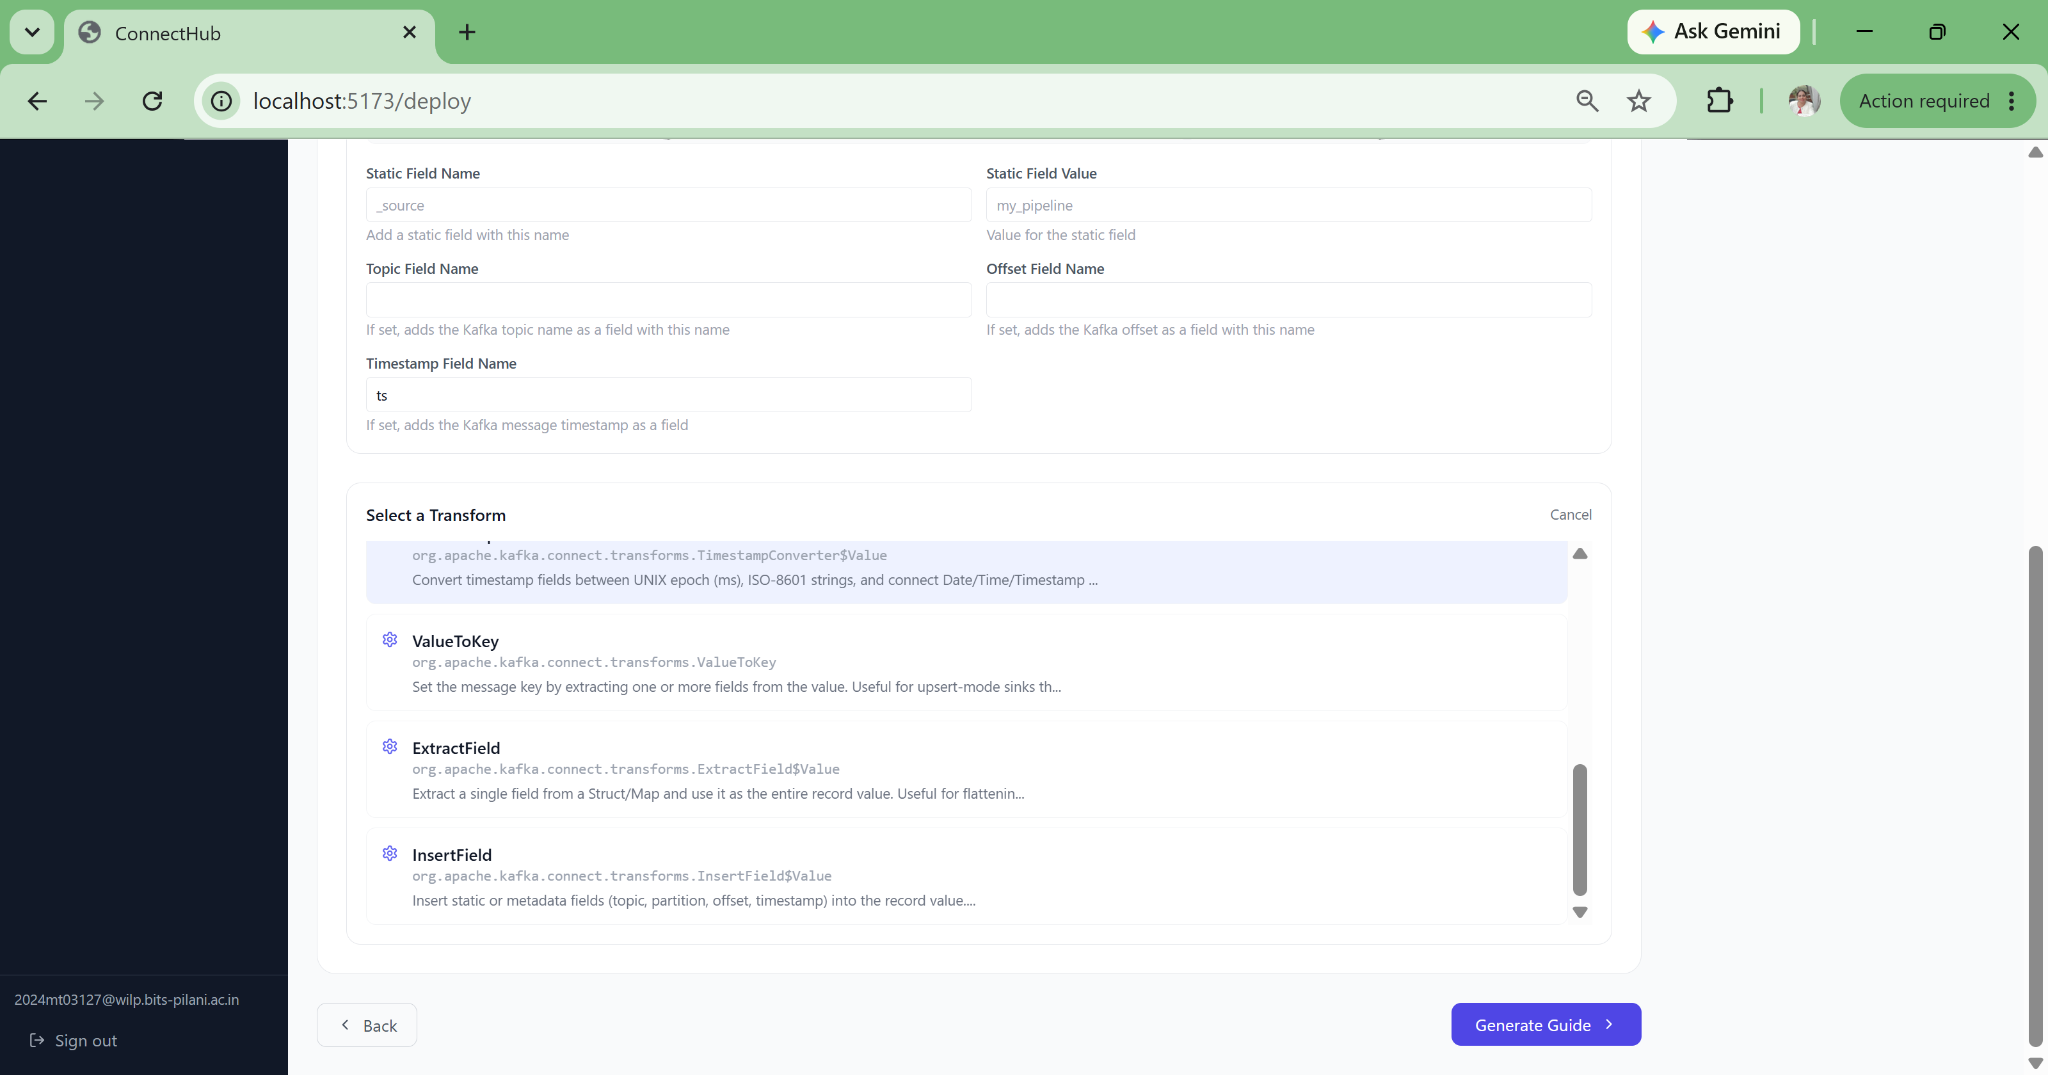
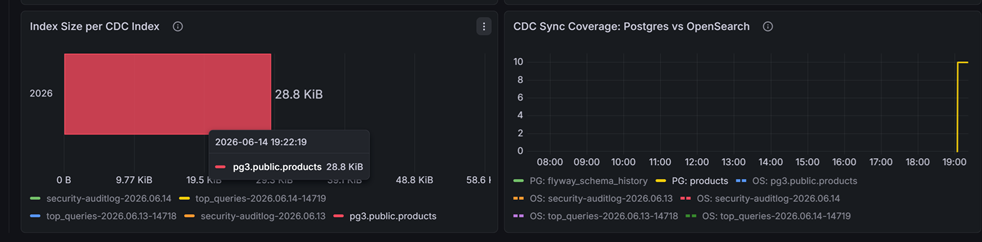
07 — LINEAGE
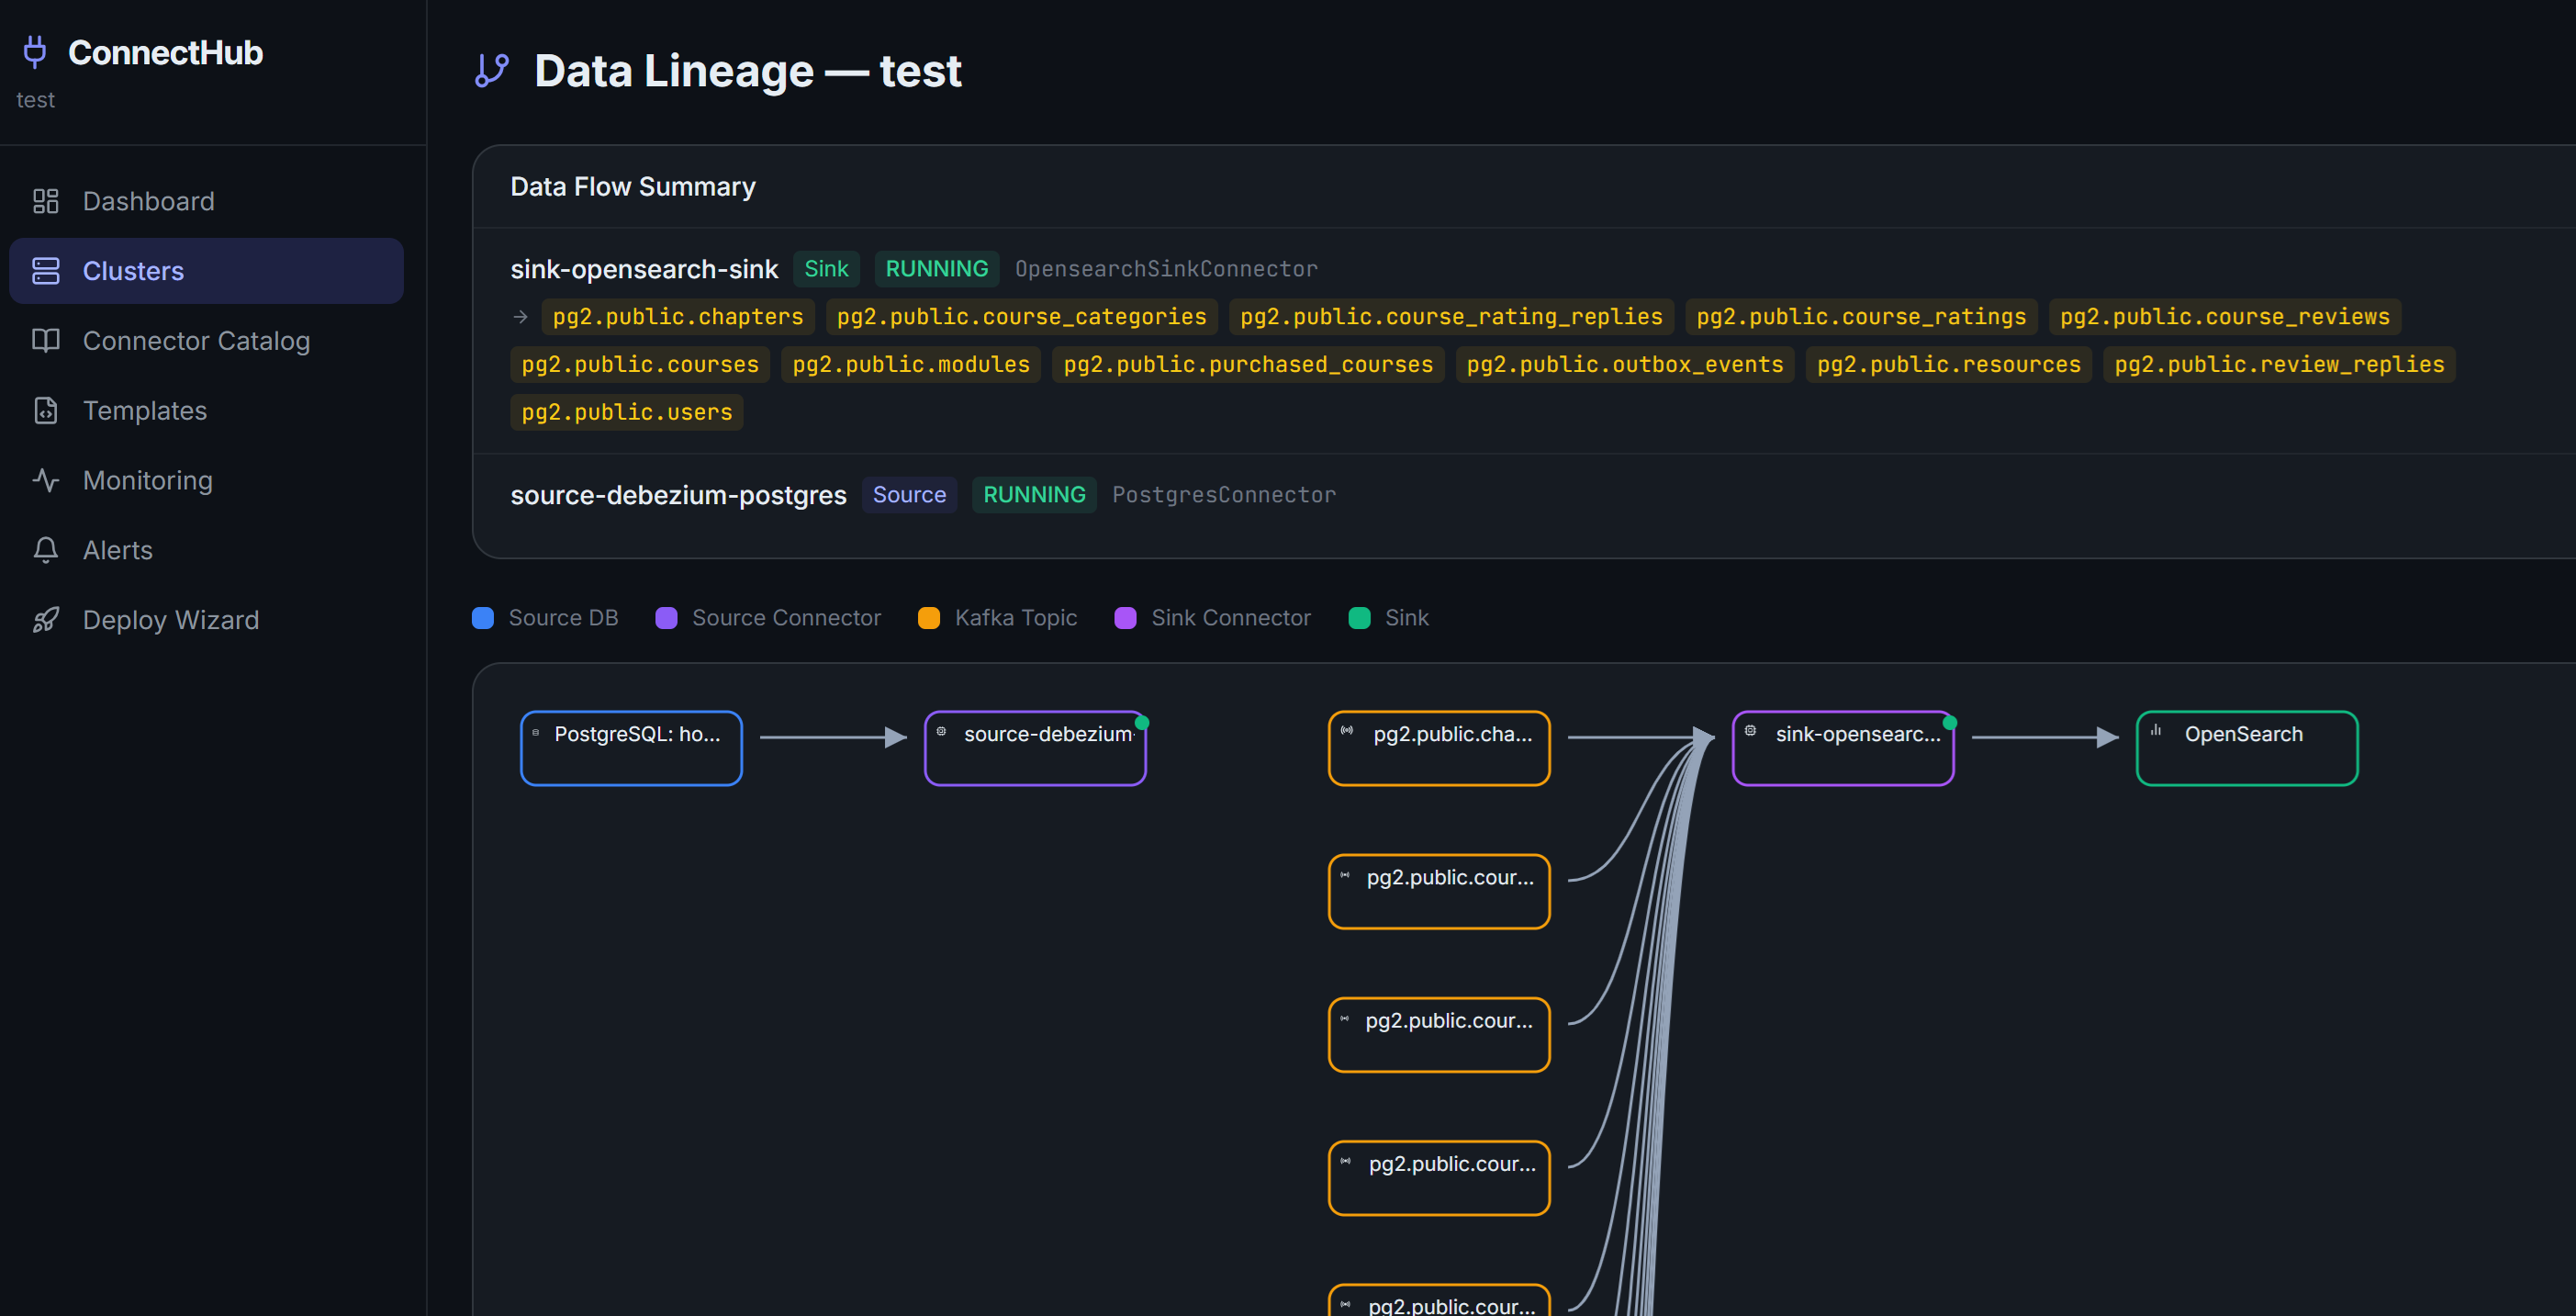
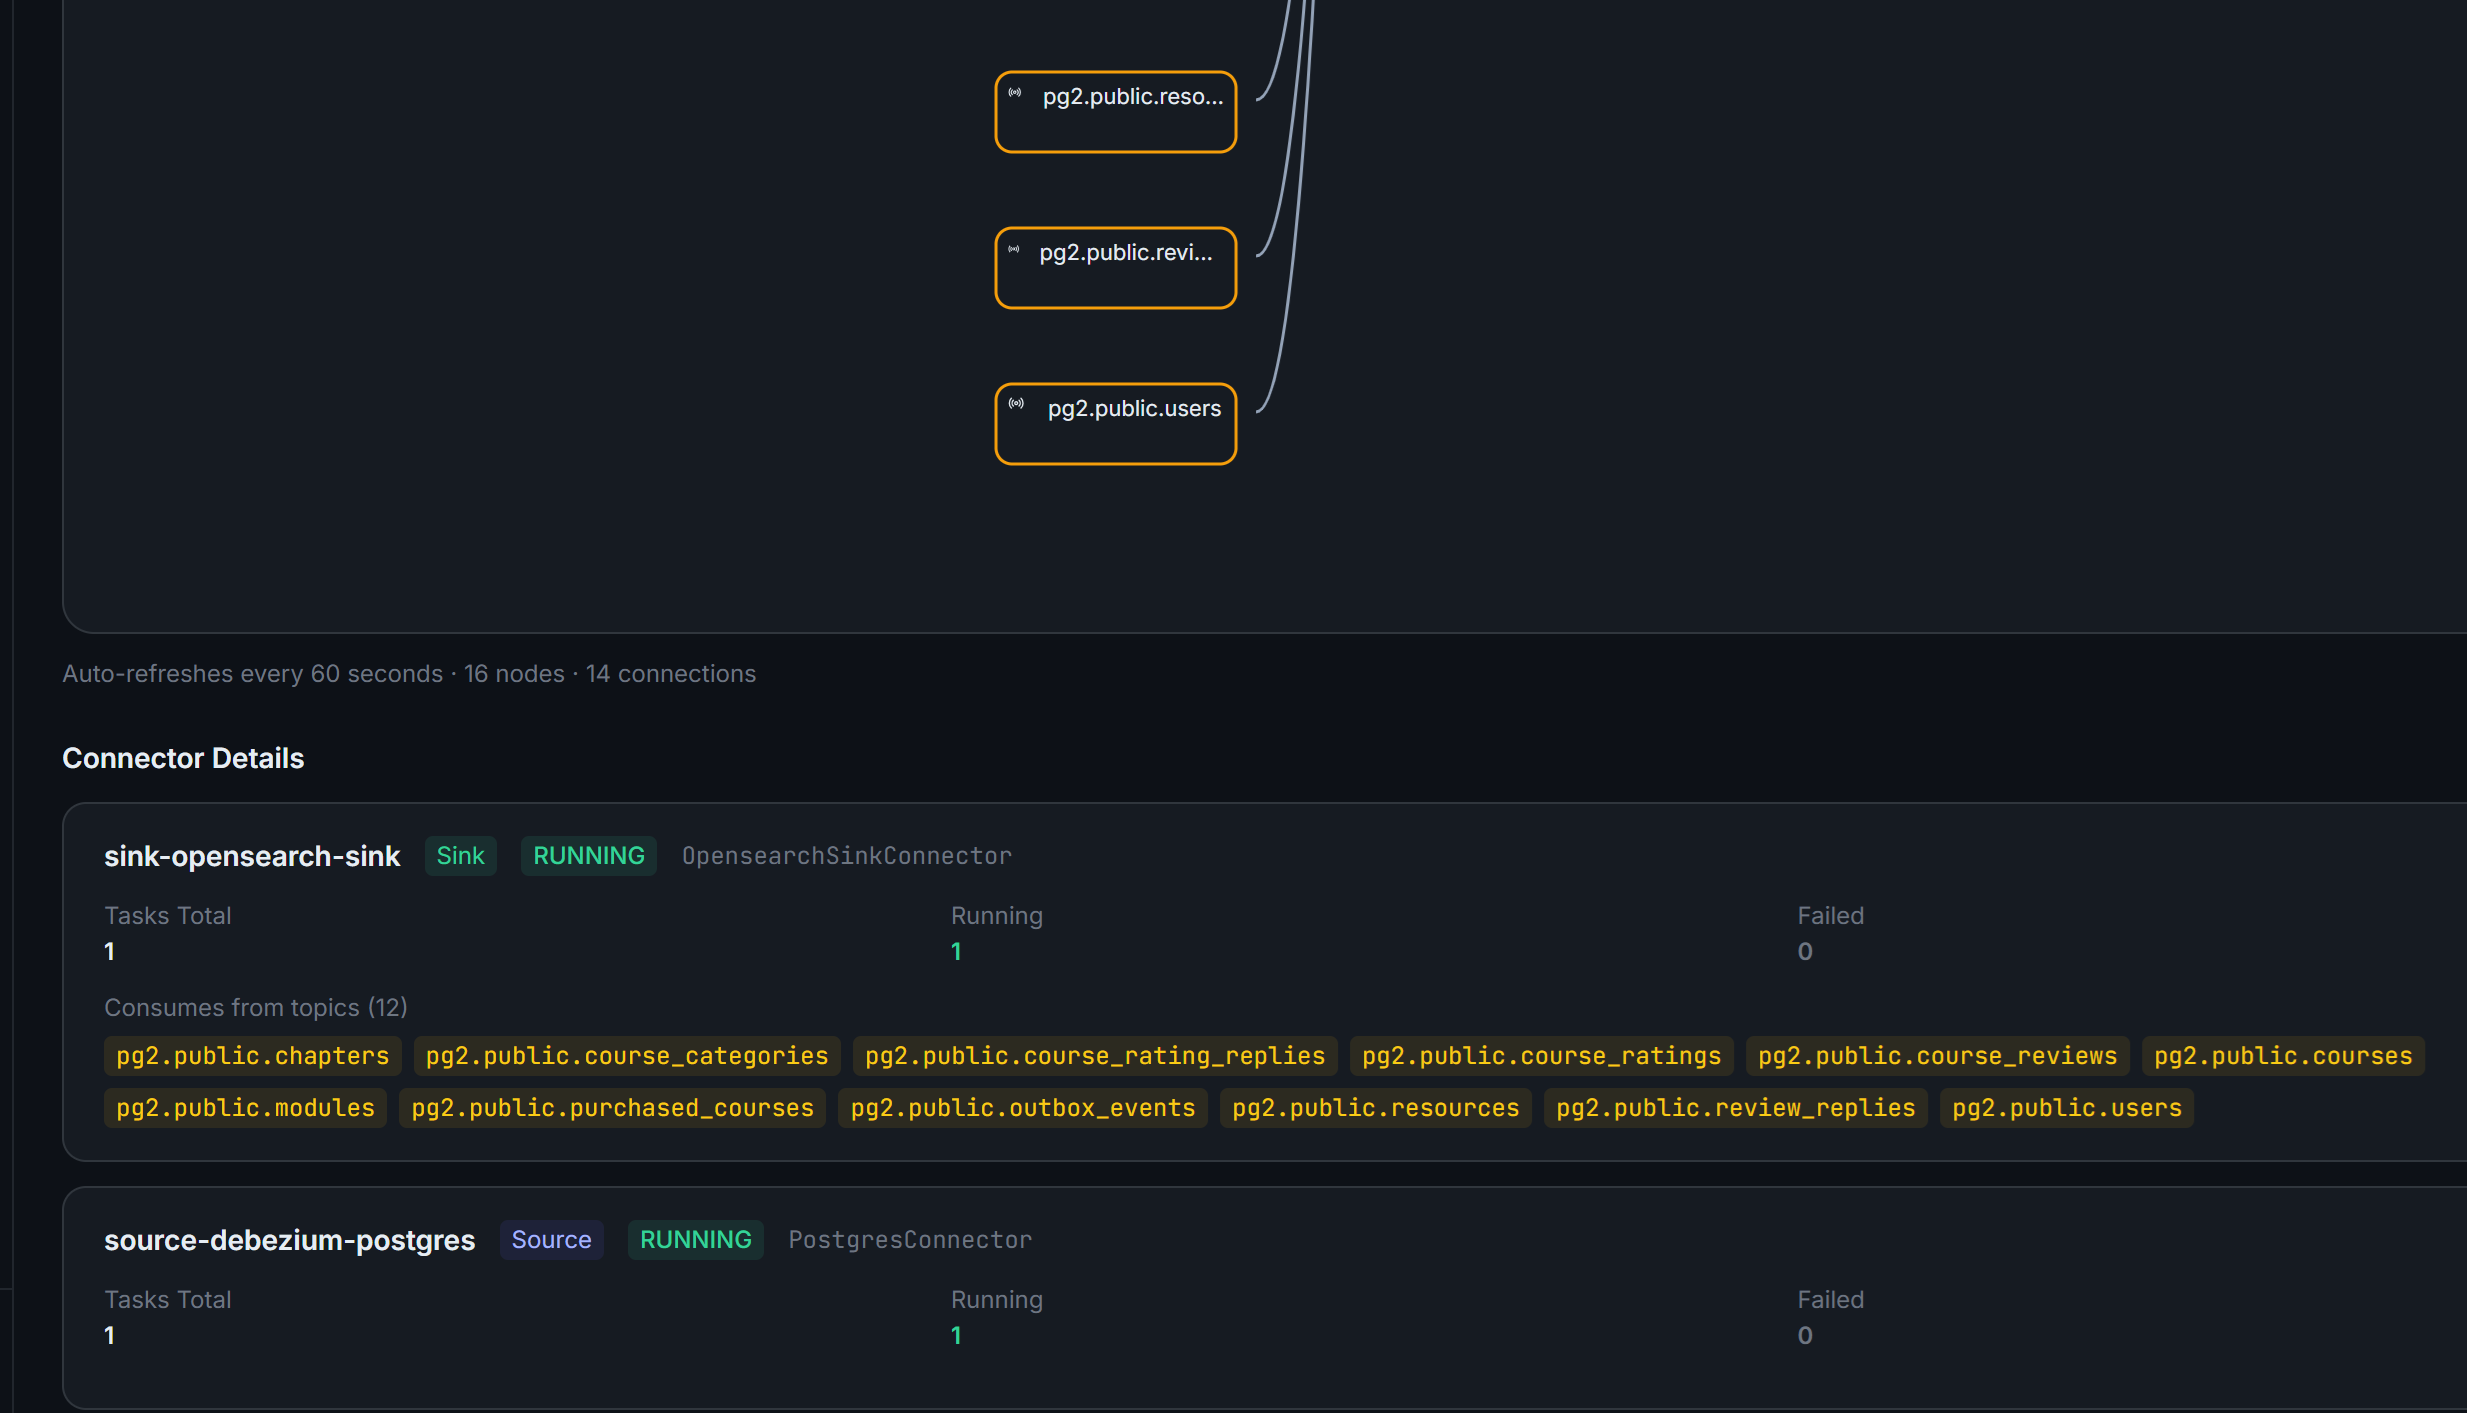
Automated Data Lineage DAG
A visual SVG directed acyclic graph automatically derived from live connector configurations, with no manual metadata entry required. Source database to connector to Kafka topic to sink to destination. Auto-refreshes every 60 seconds and is always current.
Visibility
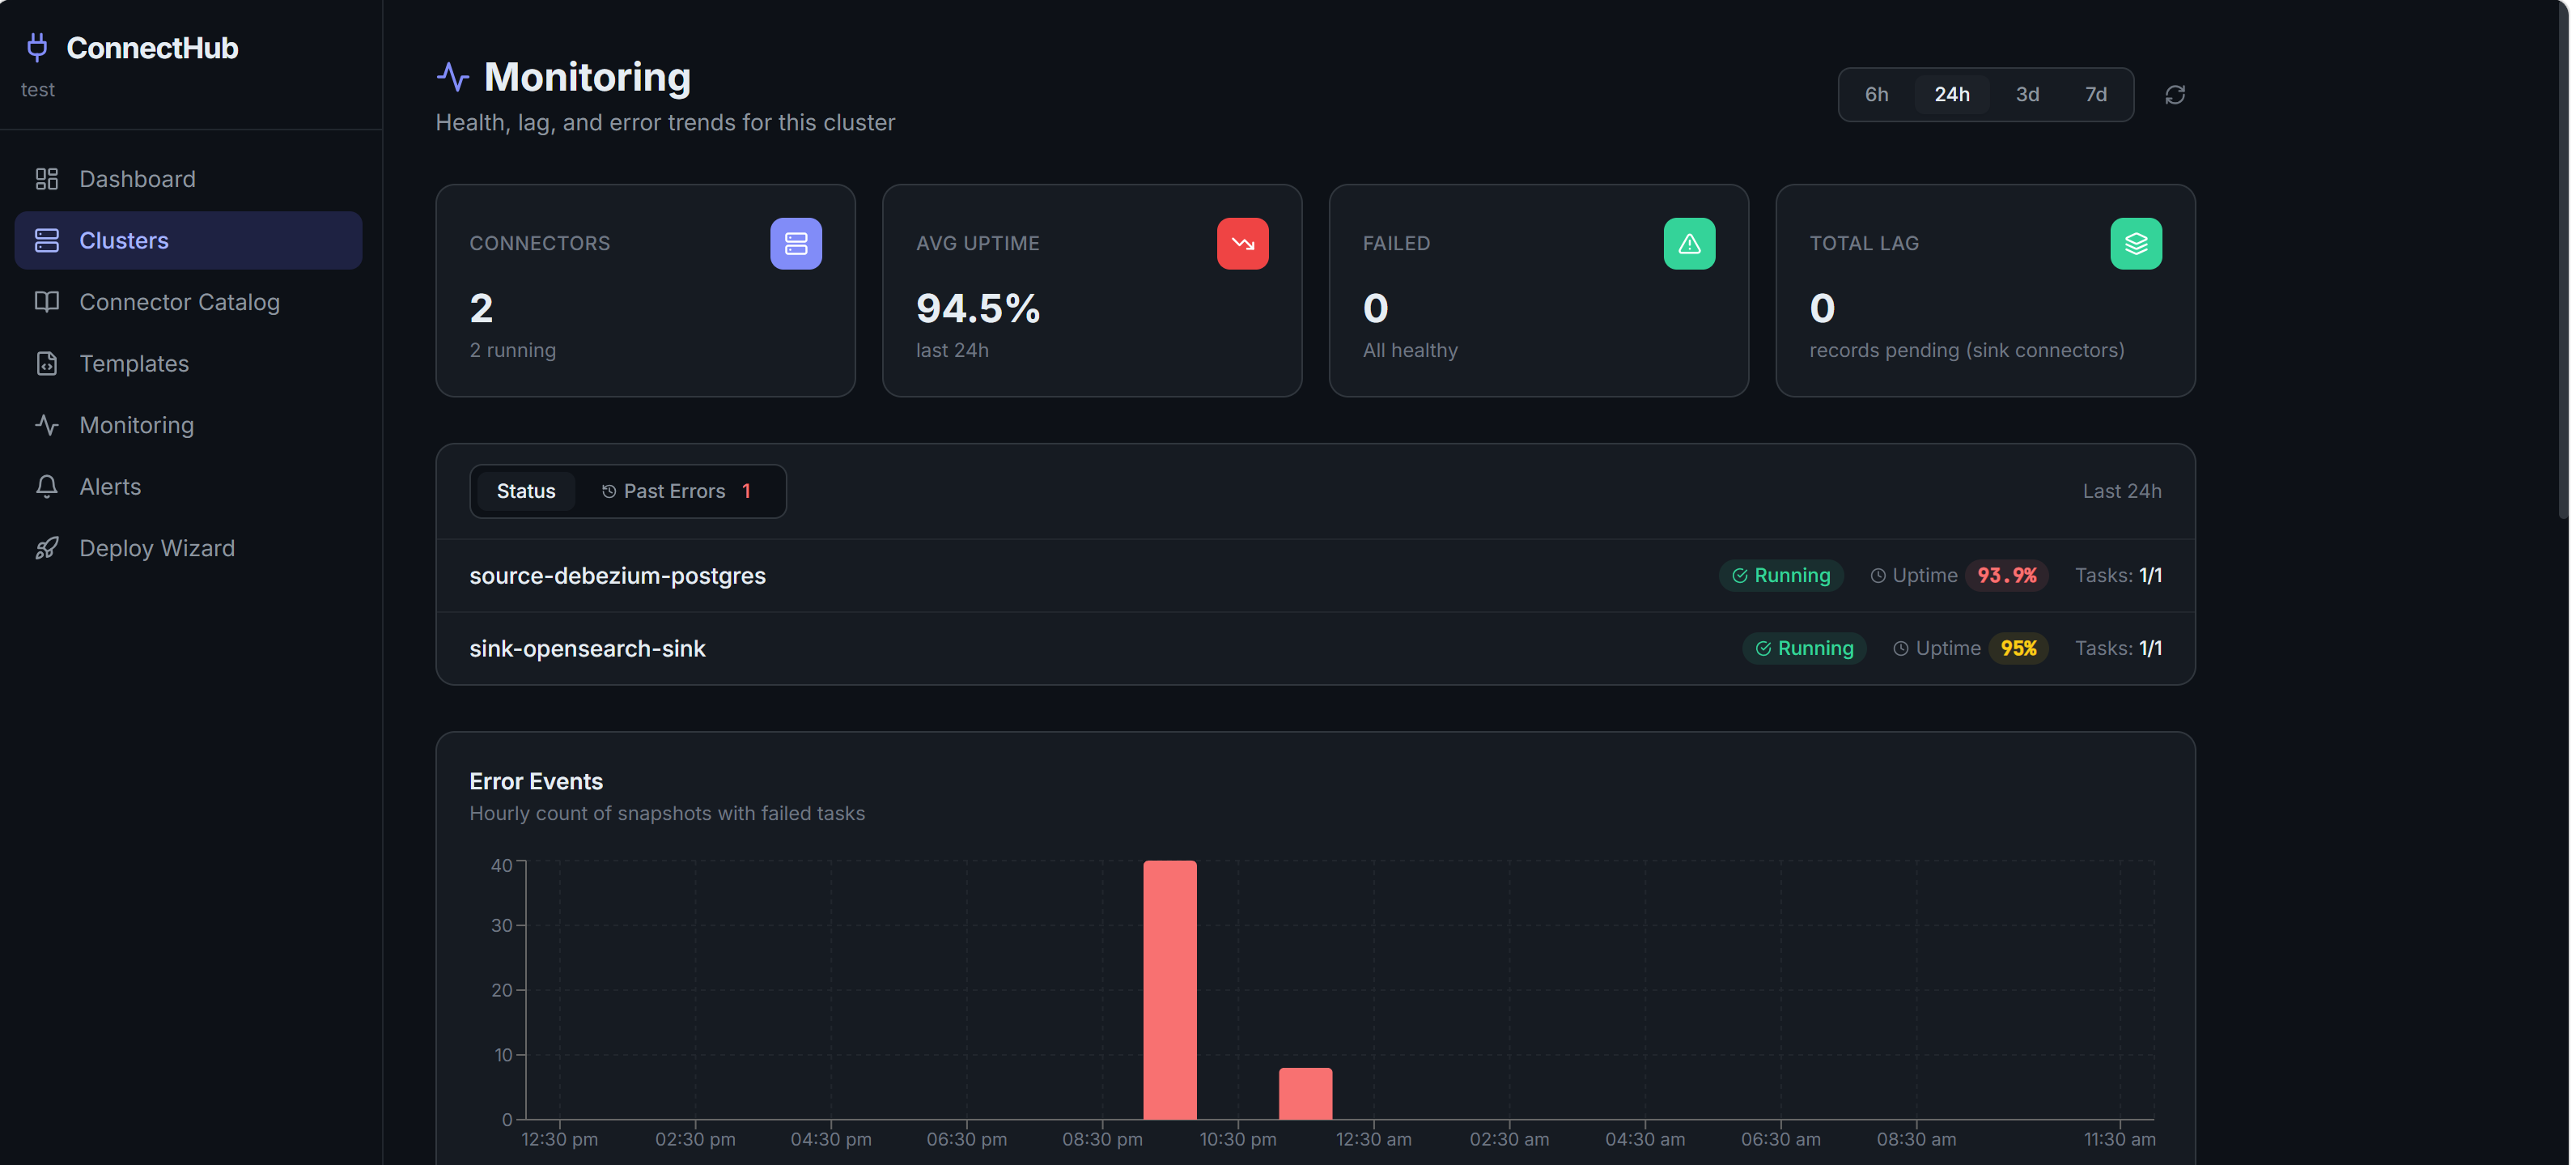
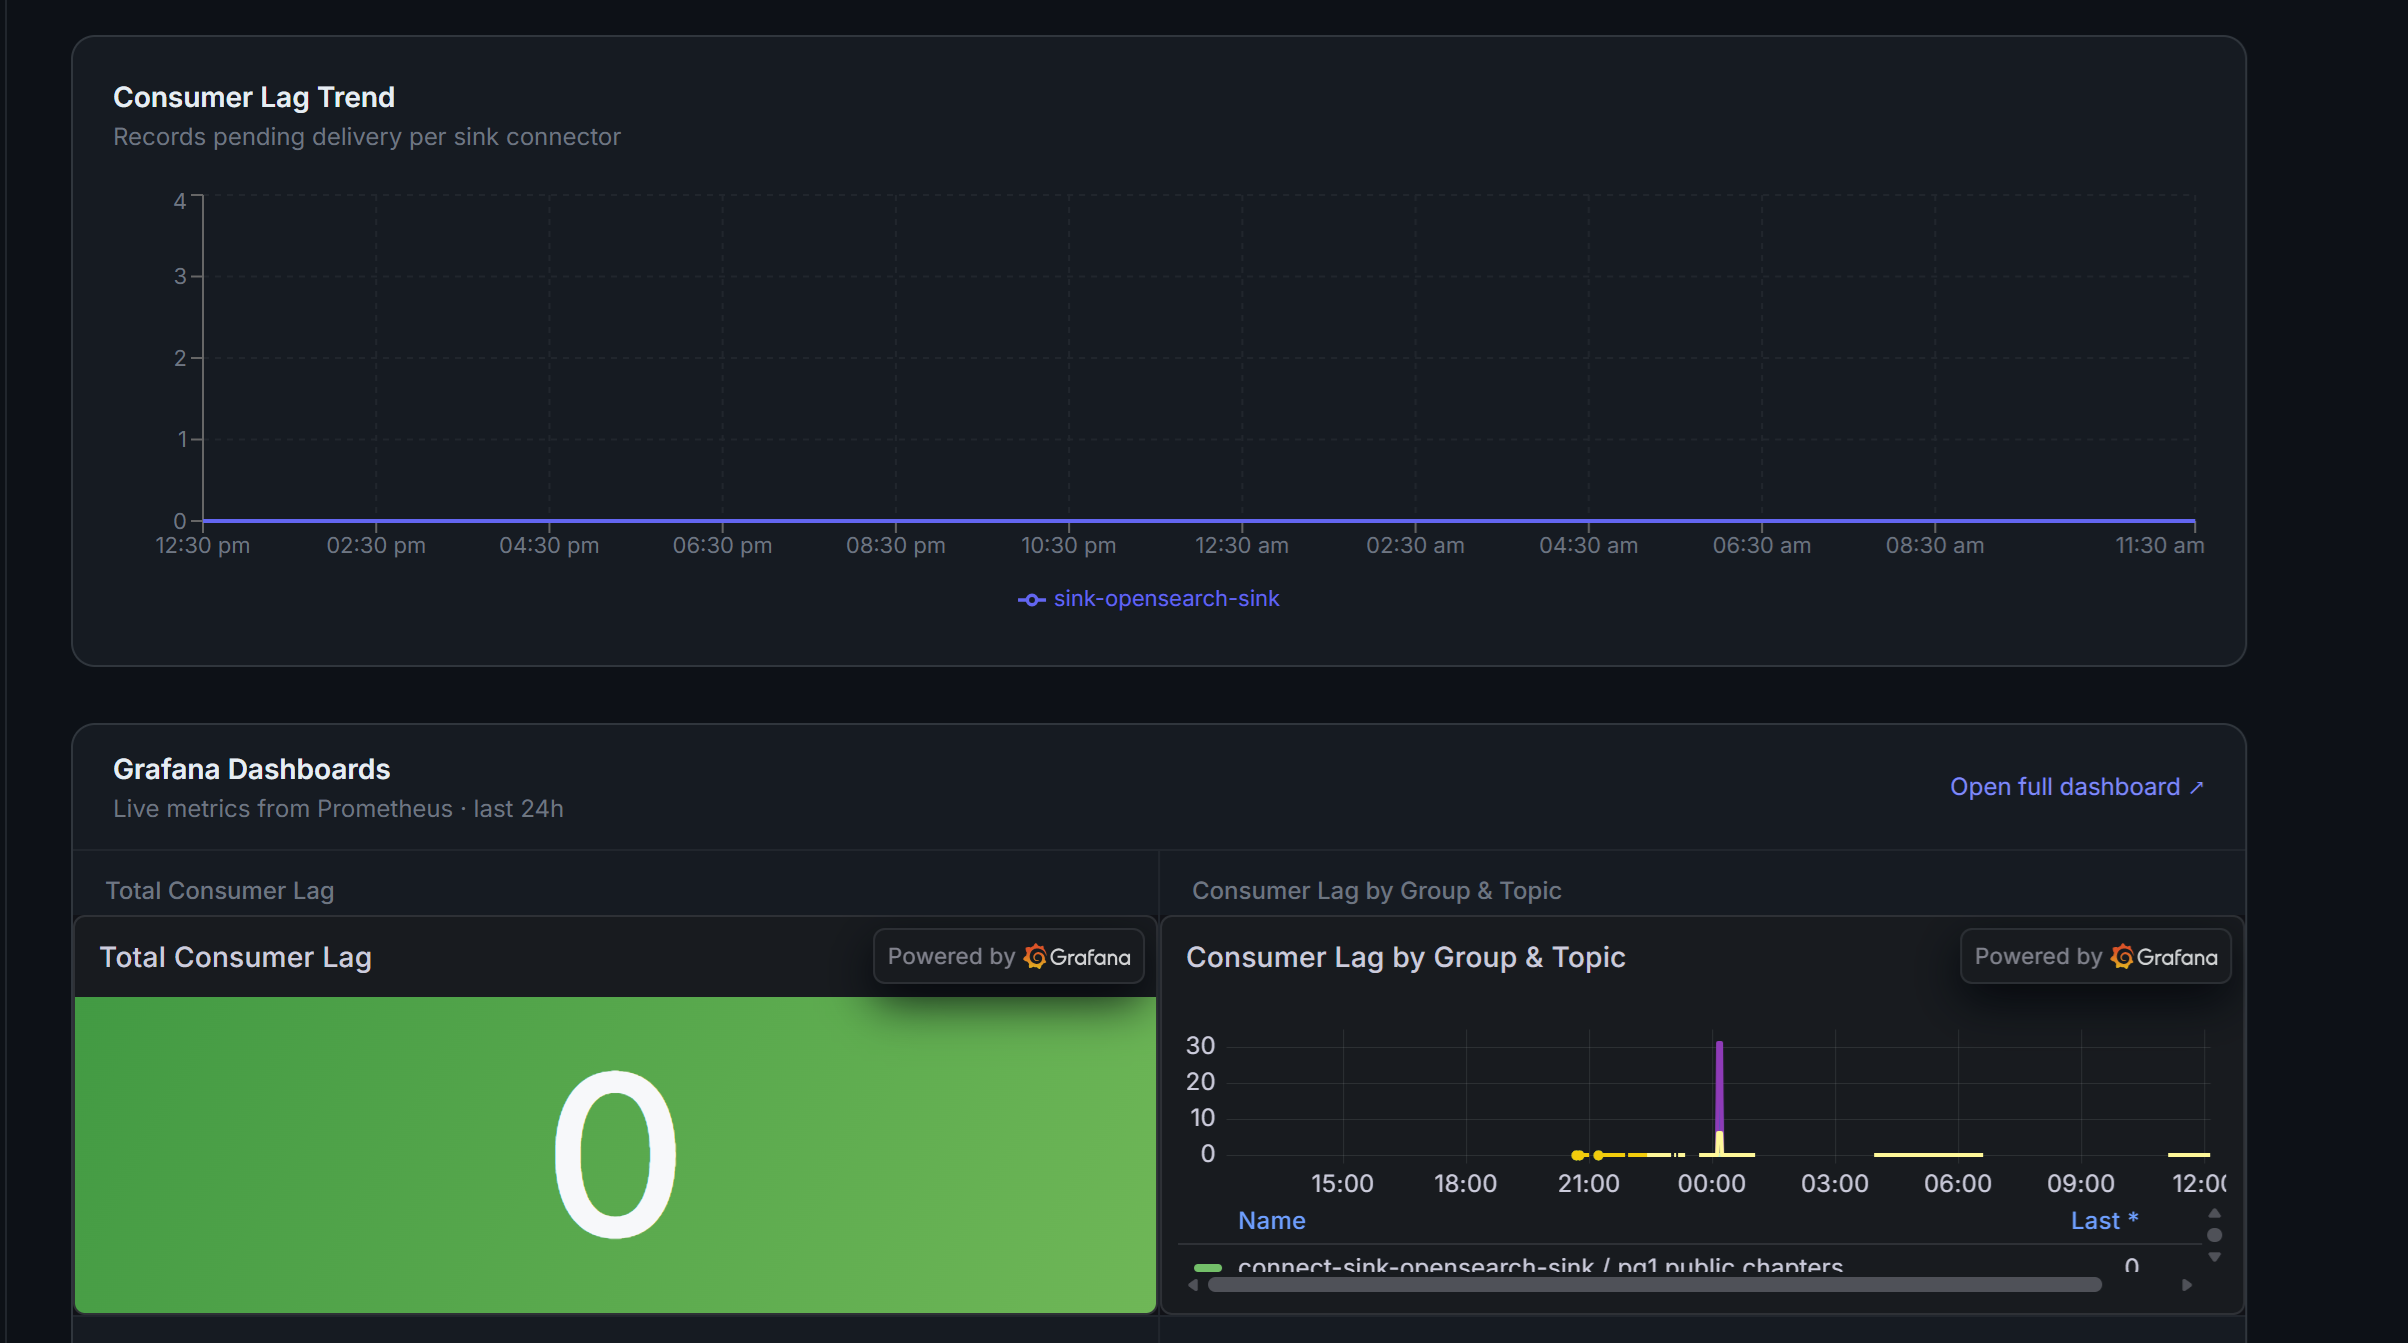
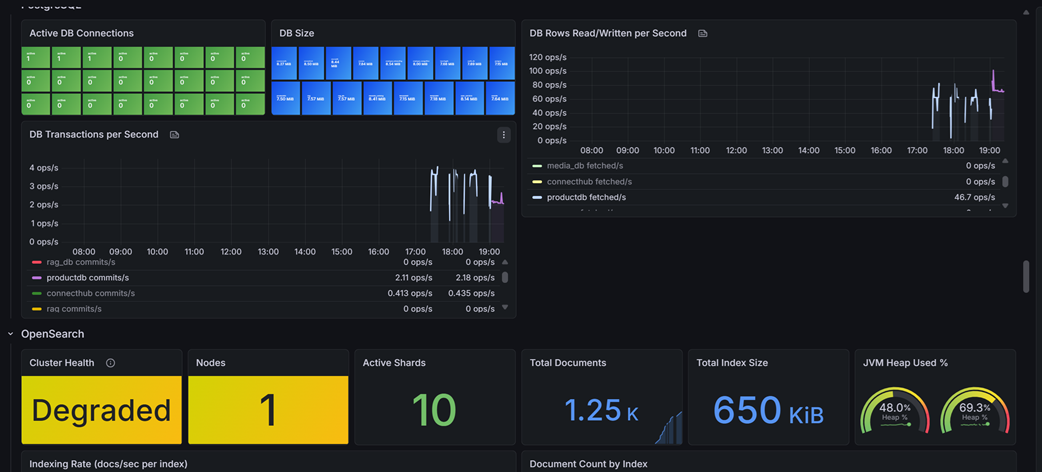
08 — MONITORING
Uptime, MTTR, and Consumer Lag Dashboards
Per-cluster: connector uptime percentage, mean time to recovery computed from FAILED-to-RUNNING transitions, hourly error timeline, and consumer lag trends per sink connector. Time windows from 6h to 7d. Auto-refreshes every 60 seconds.
Operations
09 — KUBERNETES
One-Click Strimzi Manifest Generation
Generates Strimzi KafkaConnector CRDs plus a separate Secret object, where credentials are never embedded in the CRD. Namespace-configurable. Base64-encoded and reference-linked for clean GitOps workflows. Helm commands included in the same view.
Infrastructure
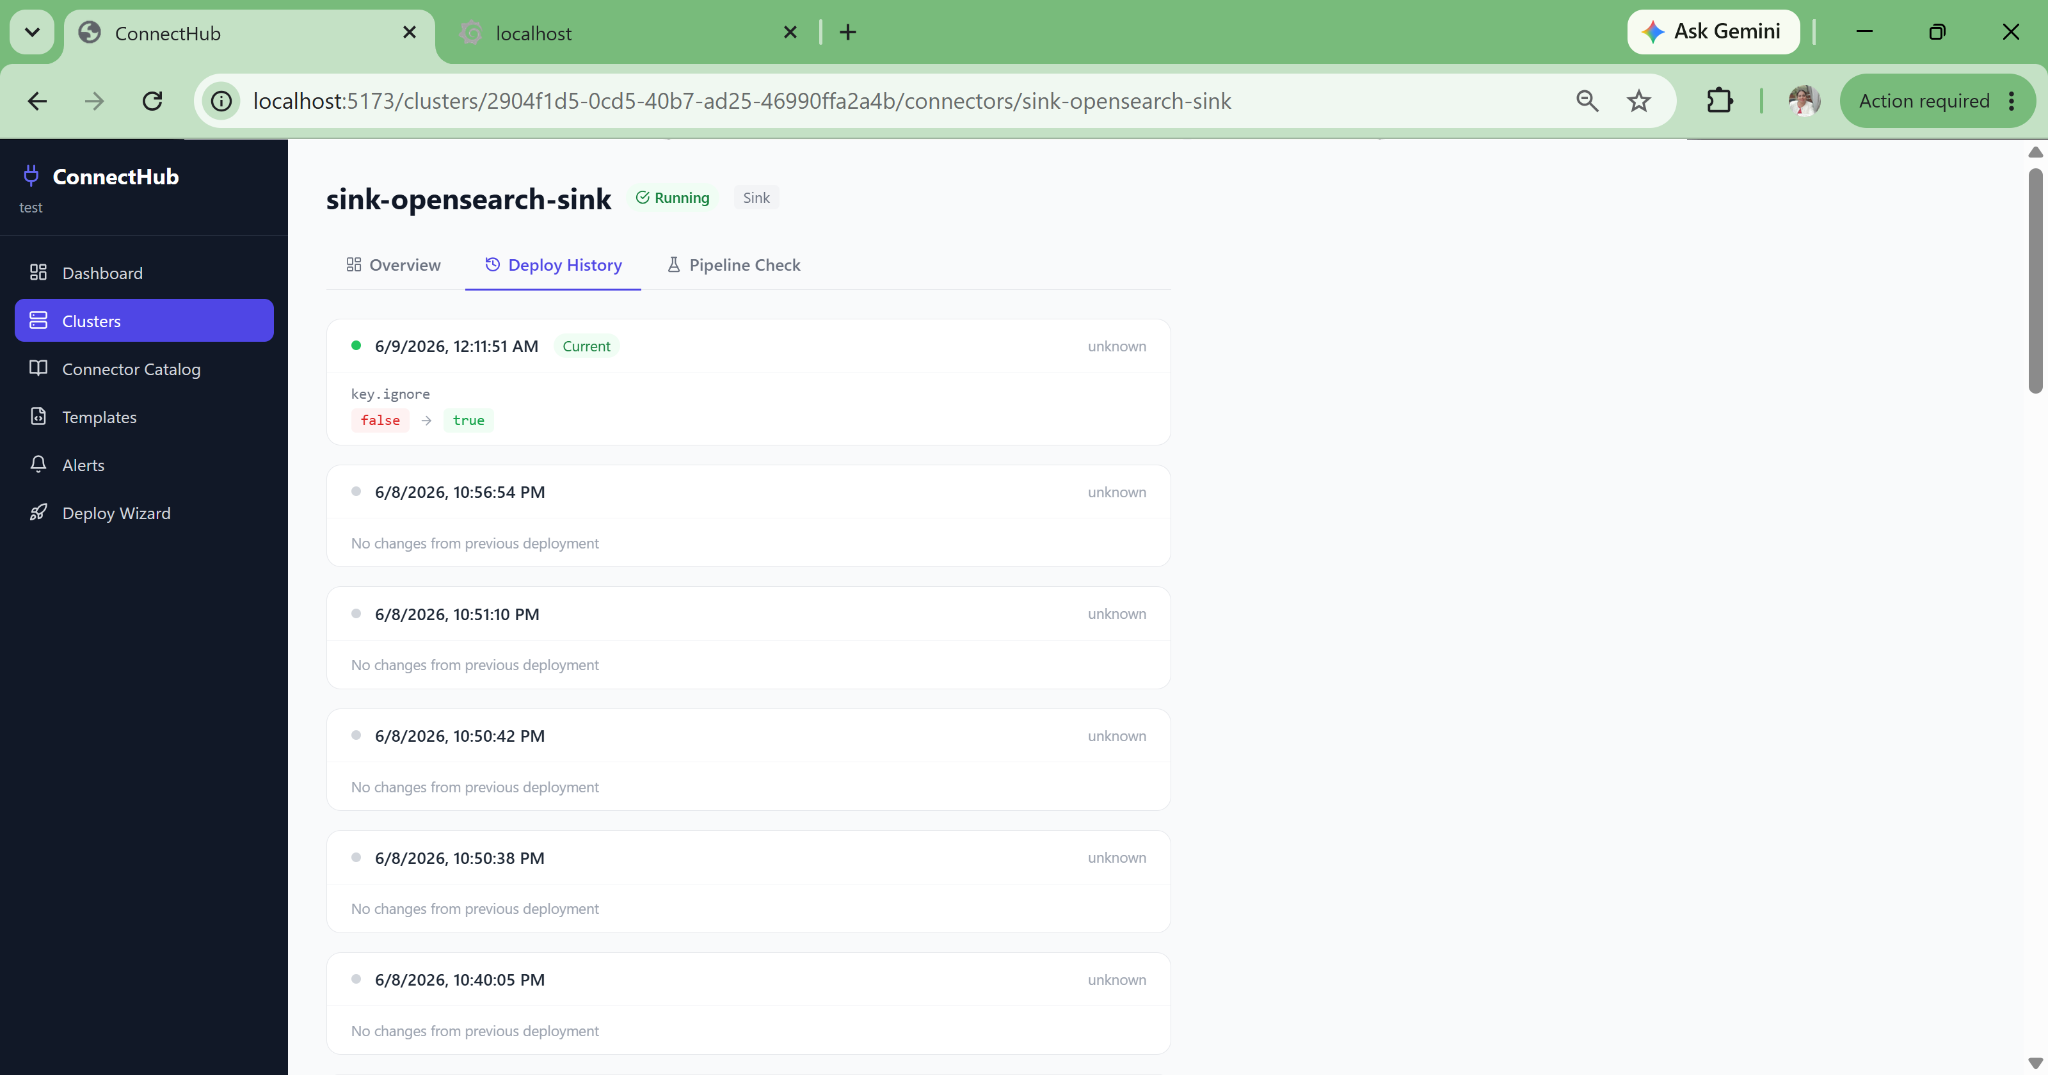
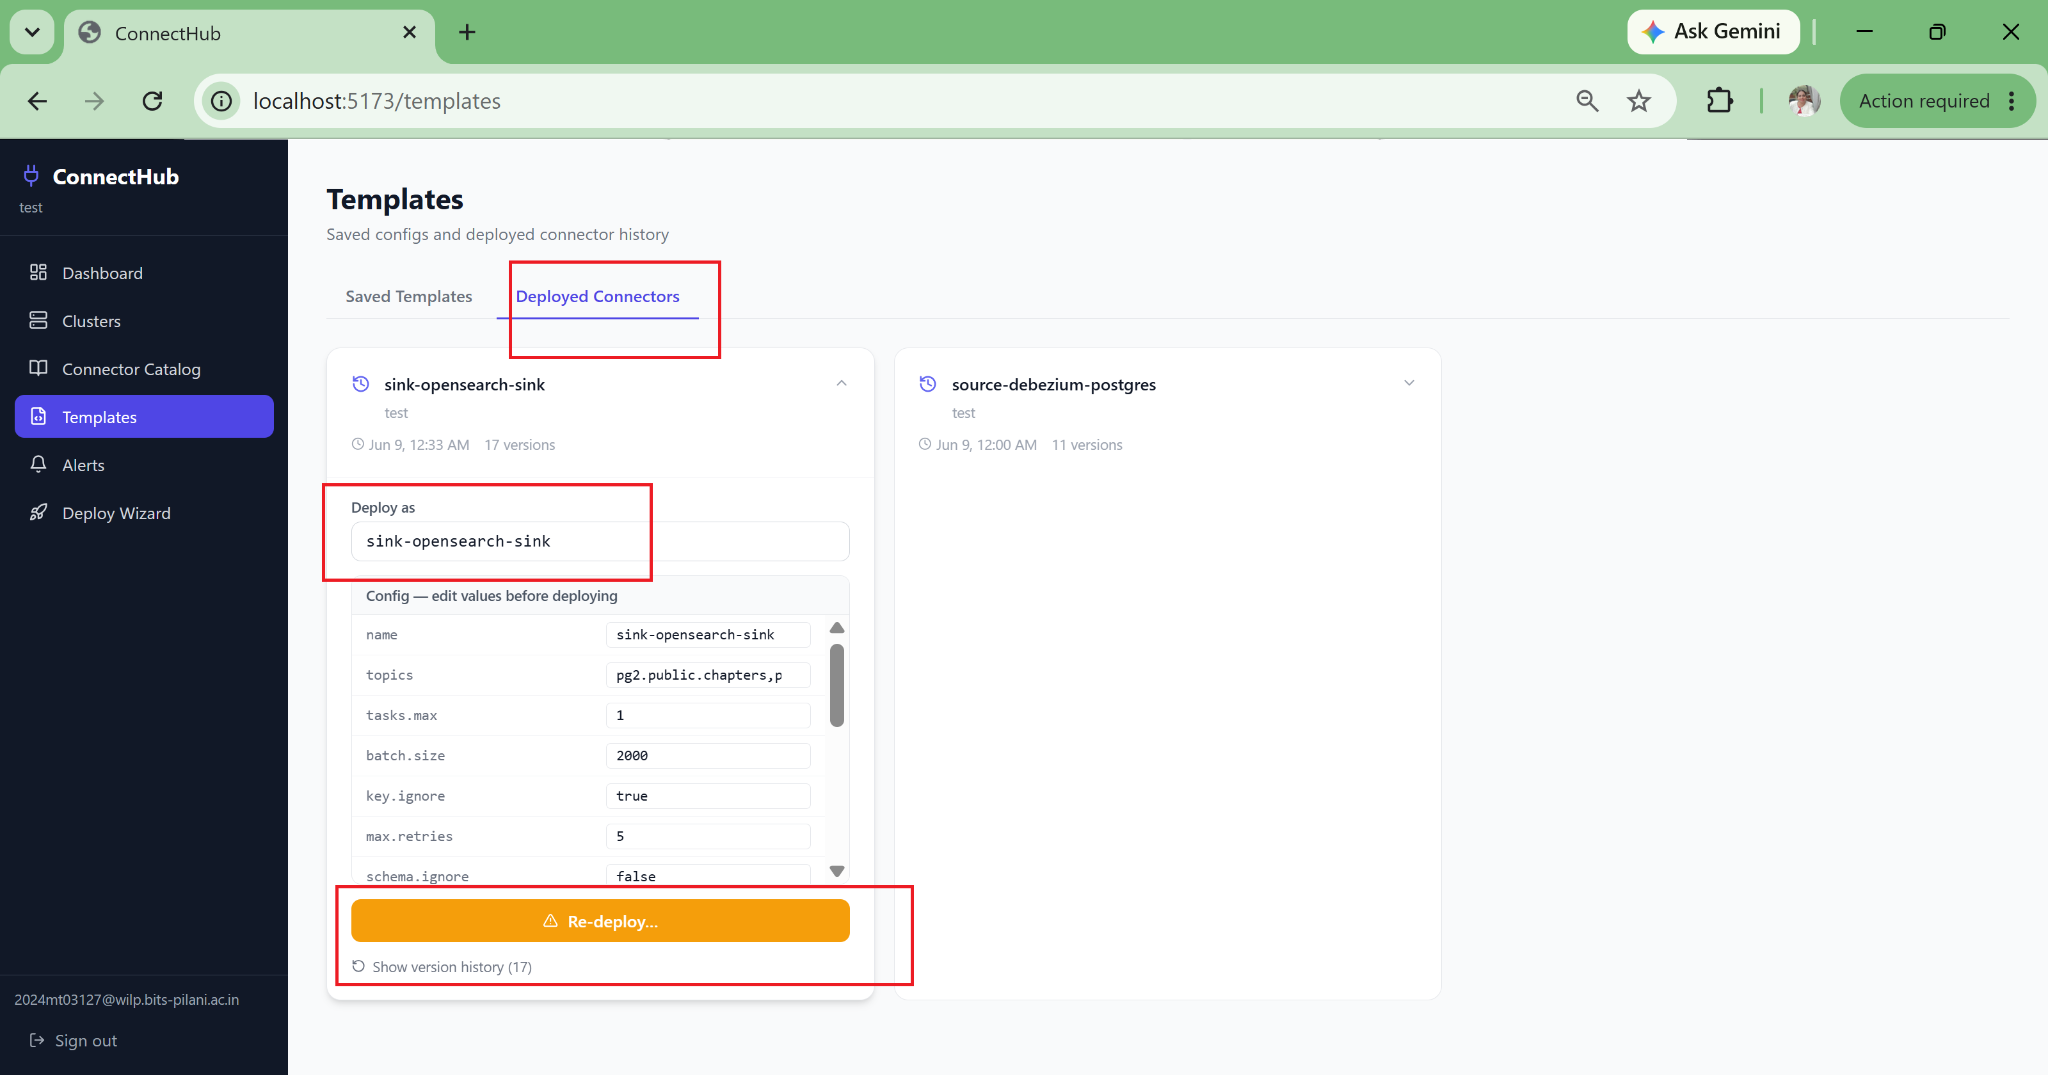
10 — AUDITABILITY
Full Config Change History and Audit Trail
Every configuration change persisted with a diff view: which properties changed, old and new values, timestamp, who made the change. Passwords masked in history. Answers "who changed this connector config and when?" immediately after a 2am incident.
Compliance
11 — SCHEMA REGISTRY
Confluent Schema Registry Integration
Per-connector Schemas tab auto-derives topics, fetches key and value subjects, shows full version history. Evolution warnings via the SR compatibility endpoint surface schema incompatibilities before production failures occur. Avro, Protobuf, and JSON Schema supported.
Core Feature
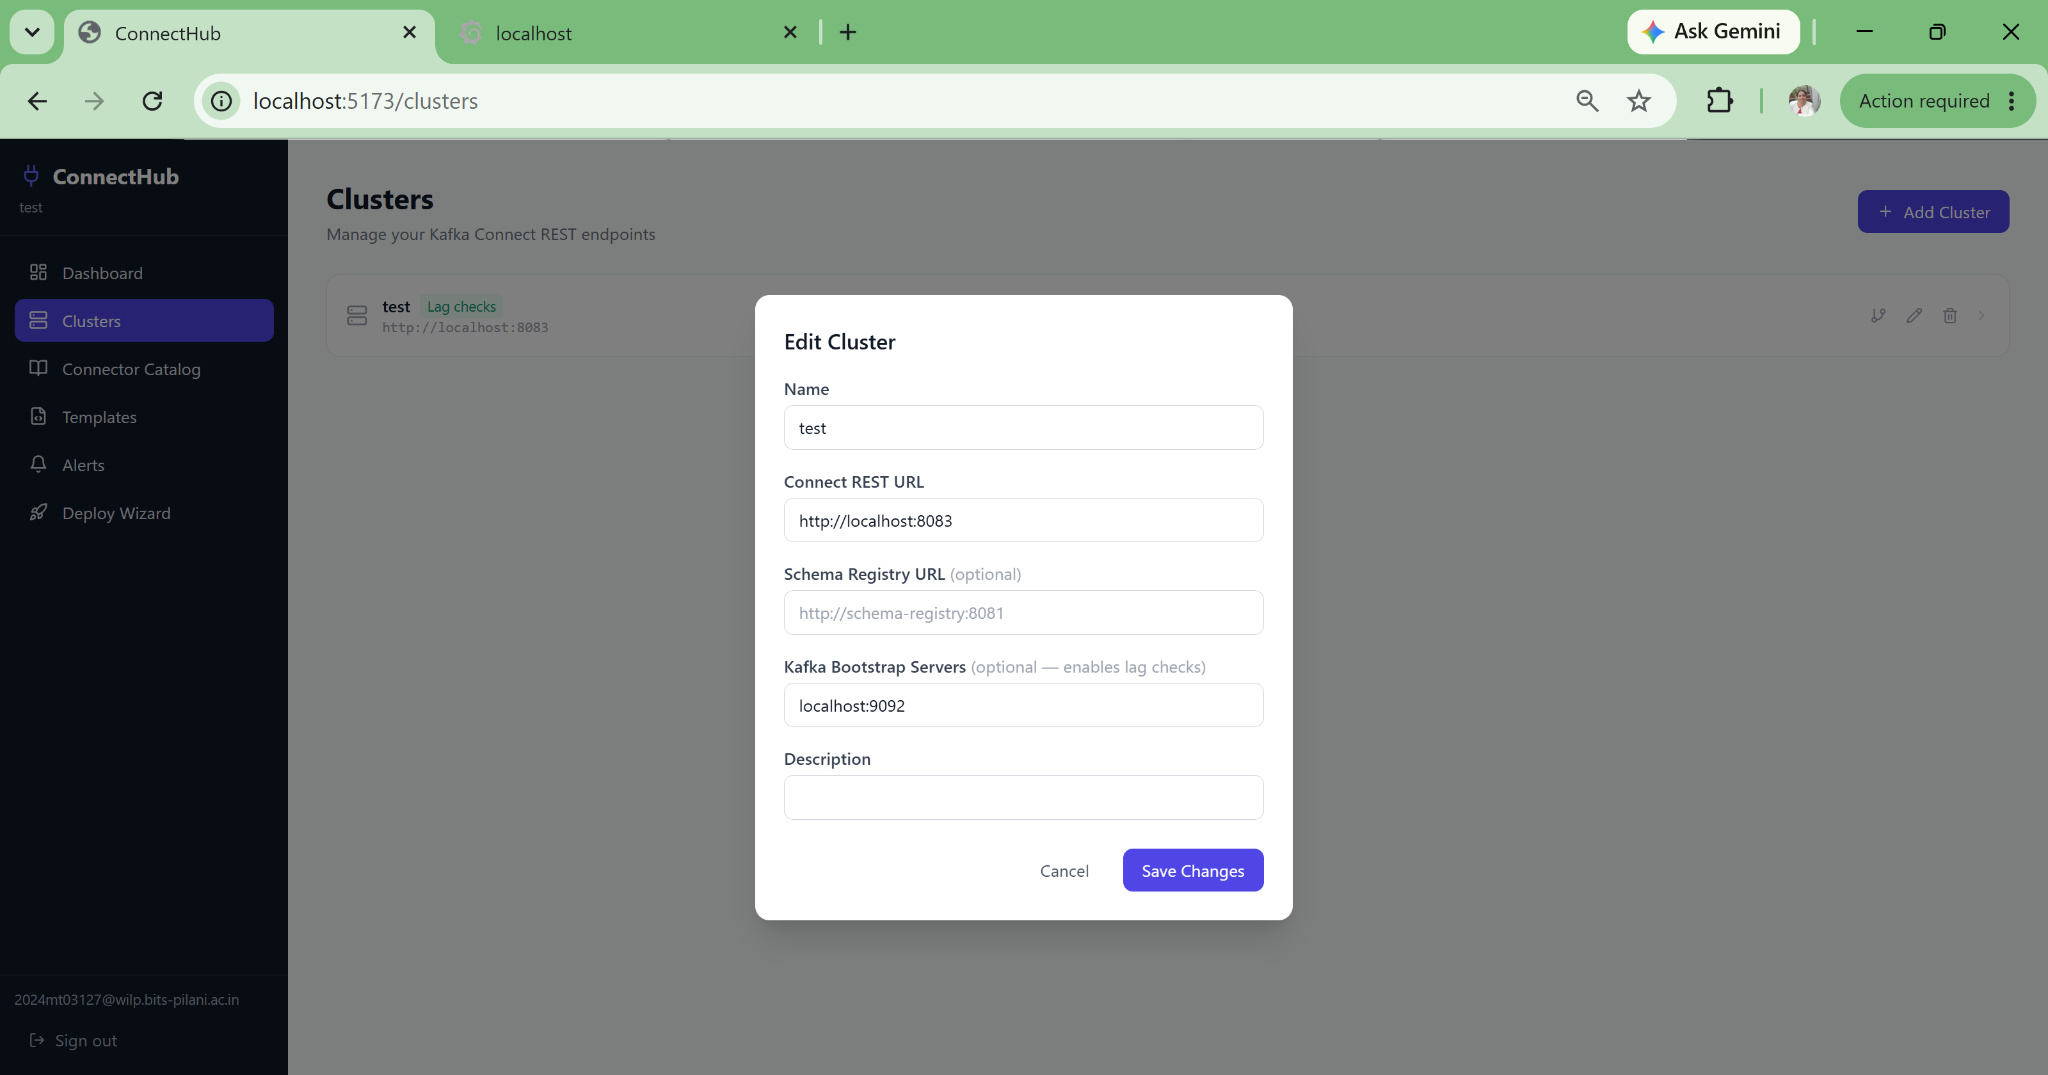
12 — MULTI-ENV
Multi-Cluster, Multi-Environment Management
Register dev, staging, prod, and multi-region Kafka Connect clusters in a single pane of glass. Full isolation prevents accidental prod deploys. Deploy to dev first, inspect configuration, then promote. Each cluster independently scoped per organisation.
Operations
13 — CONNECTOR CATALOG
Confluent Hub Connector Catalog
Browse the full Confluent Hub connector catalog directly inside ConnectHub. Every available source and sink connector is listed with its required and optional configuration properties, accepted values, and defaults. Engineers can evaluate and compare connectors before starting a pipeline, without leaving the platform or reading external documentation.
Discovery
Connector Catalog
346 connectors — sources, sinks, CDC, JDBC, search, cloud storage, data warehouse
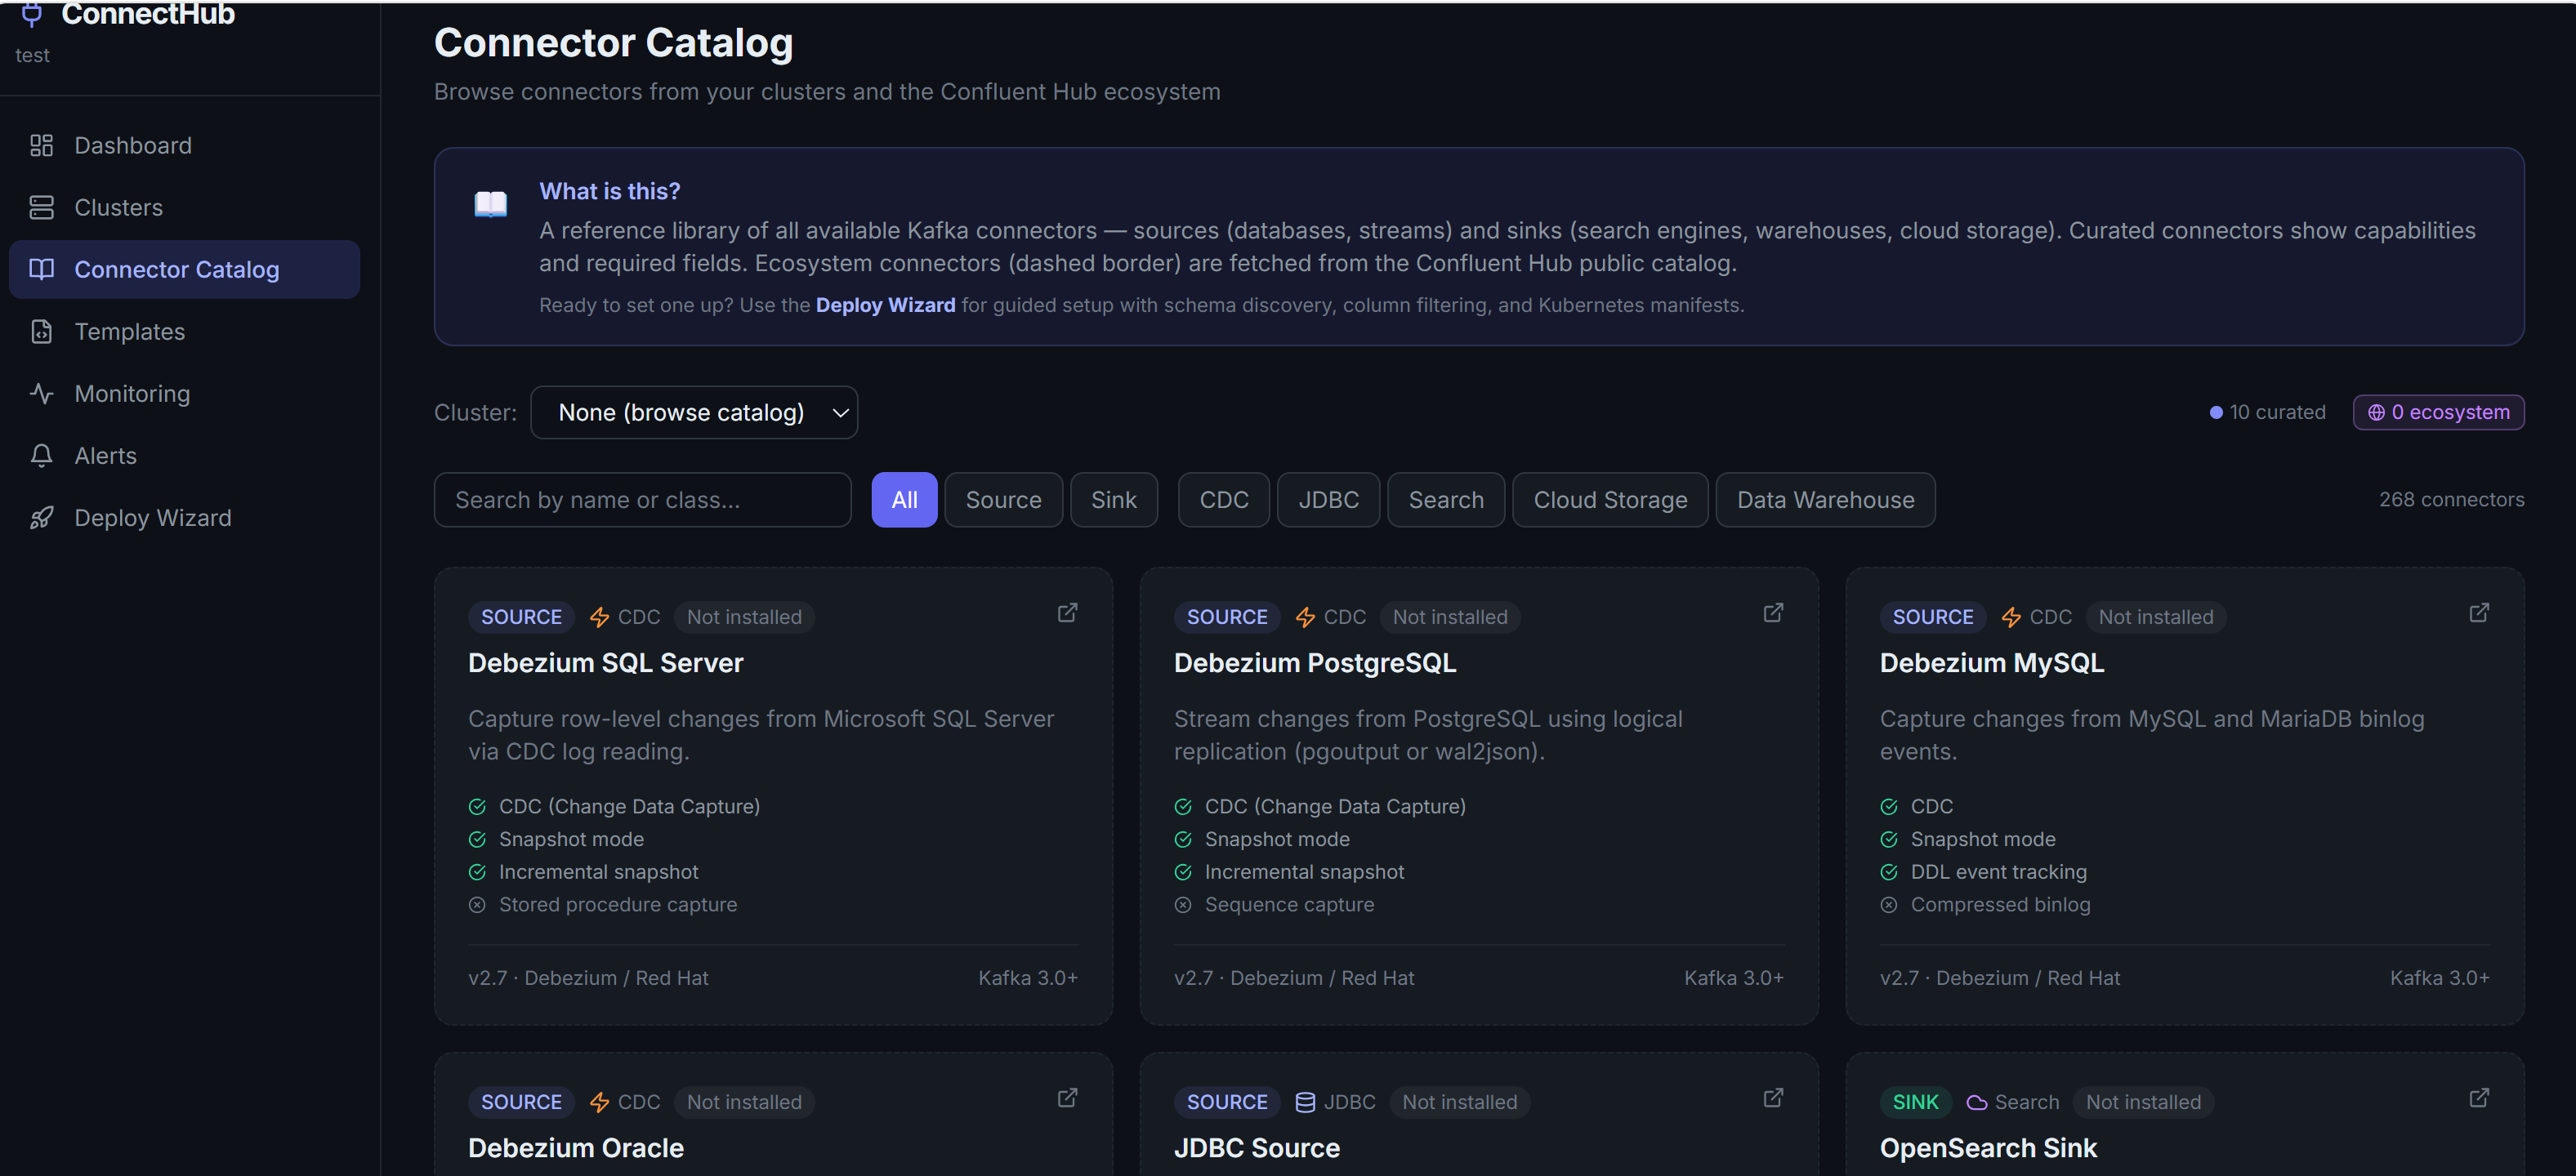
Catalog 01
Full Connector Grid
Browse 346 connectors with filter tabs — Source, Sink, CDC, JDBC, Search, Cloud Storage, Data Warehouse. Each card shows capabilities, version, and installation status against your cluster.
Catalog 02
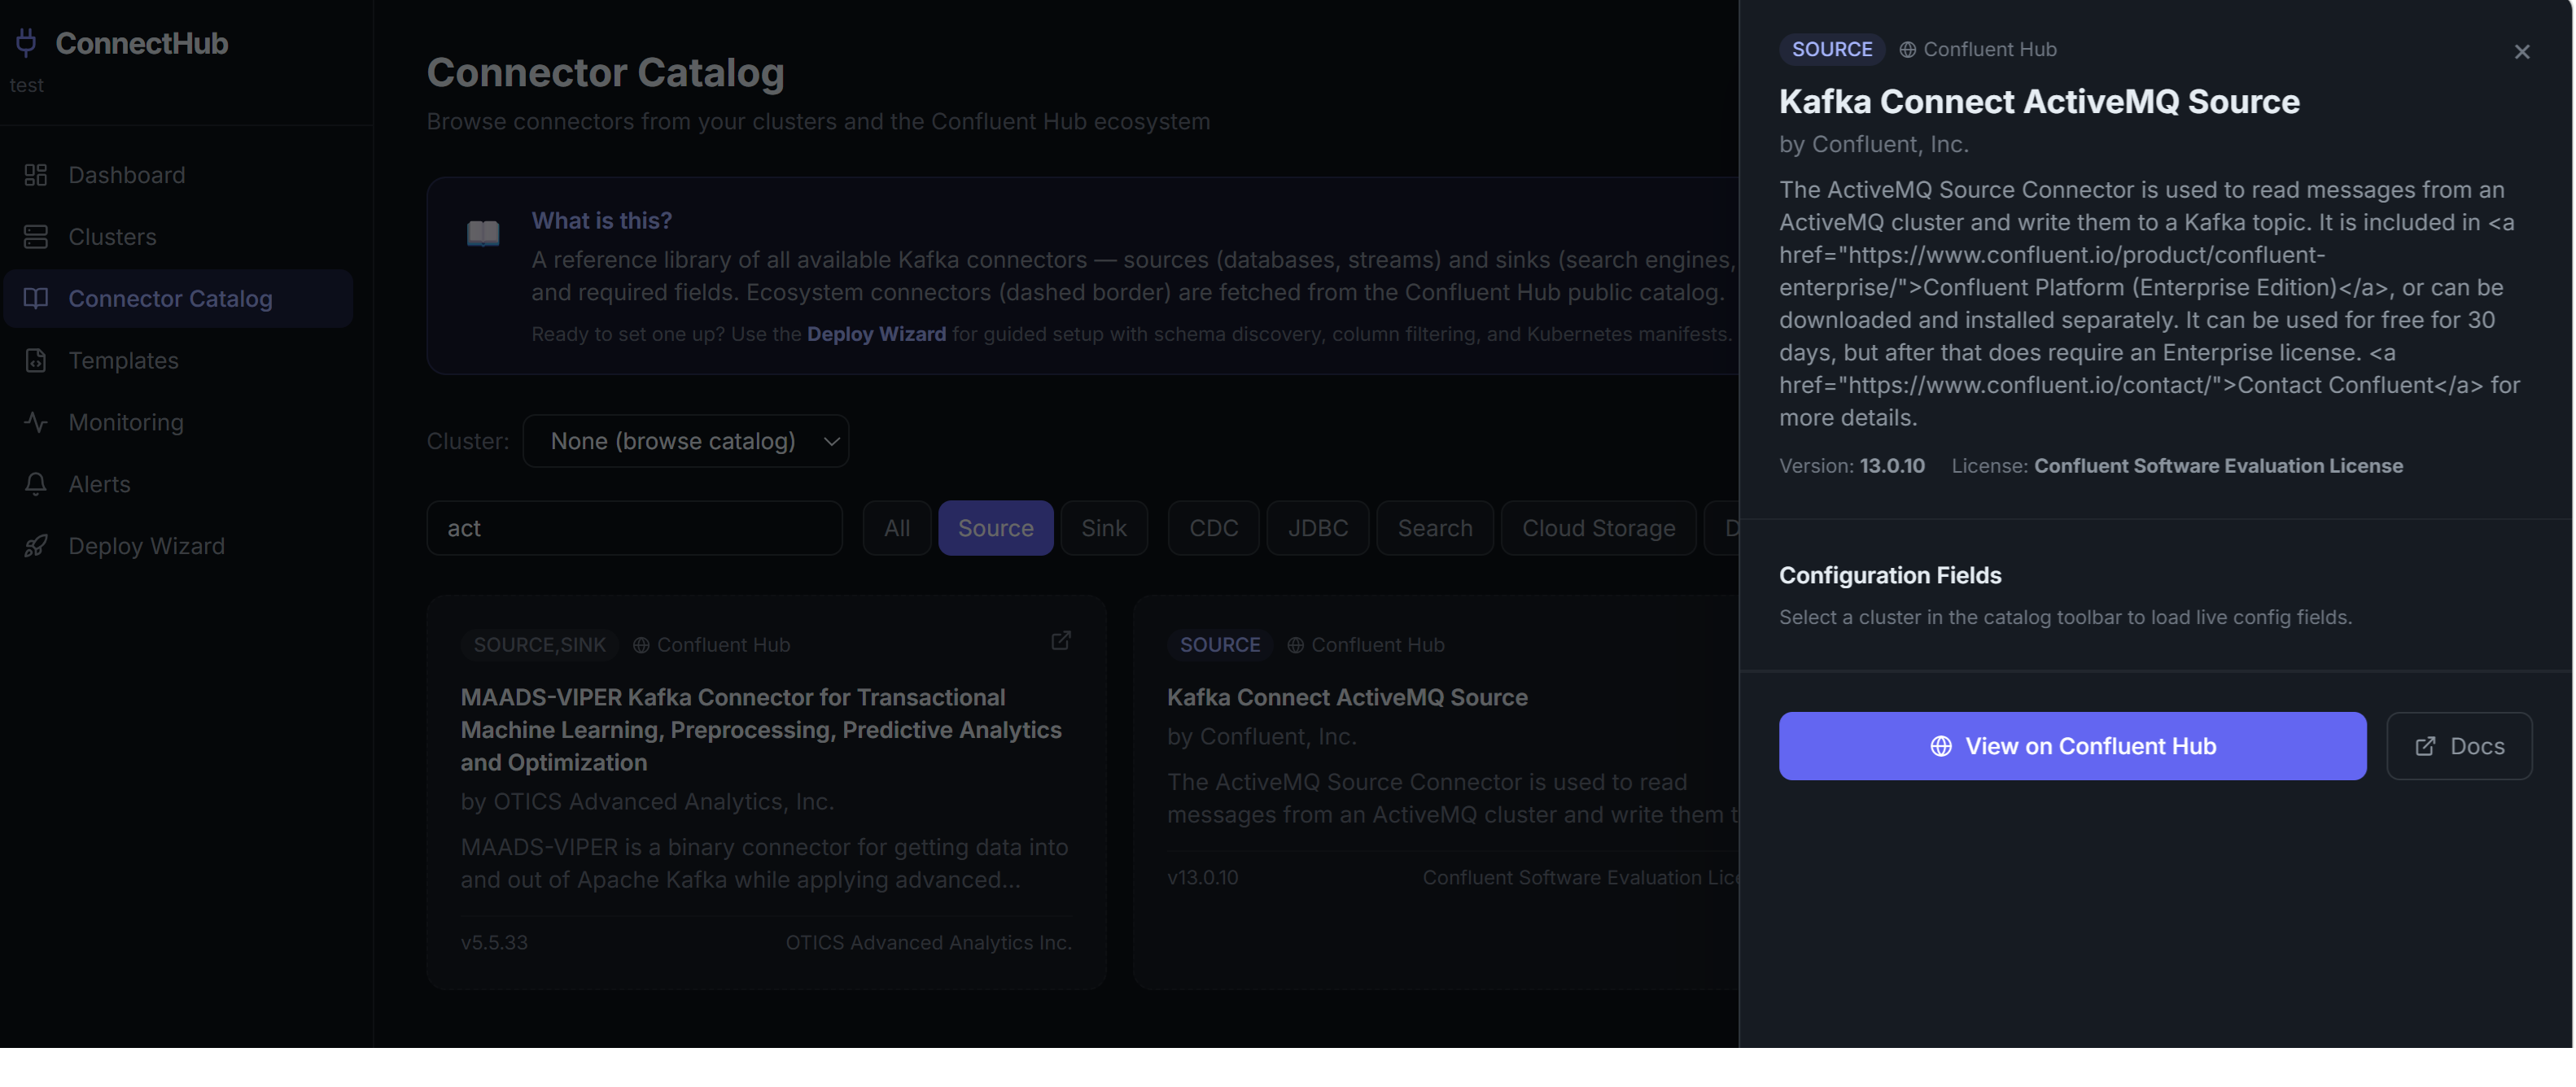
Confluent Hub Integration
Ecosystem connectors (ActiveMQ, MAADS-VIPER, and hundreds more) open in a detail panel with full configuration reference and a direct link to Confluent Hub — no tab-switching.
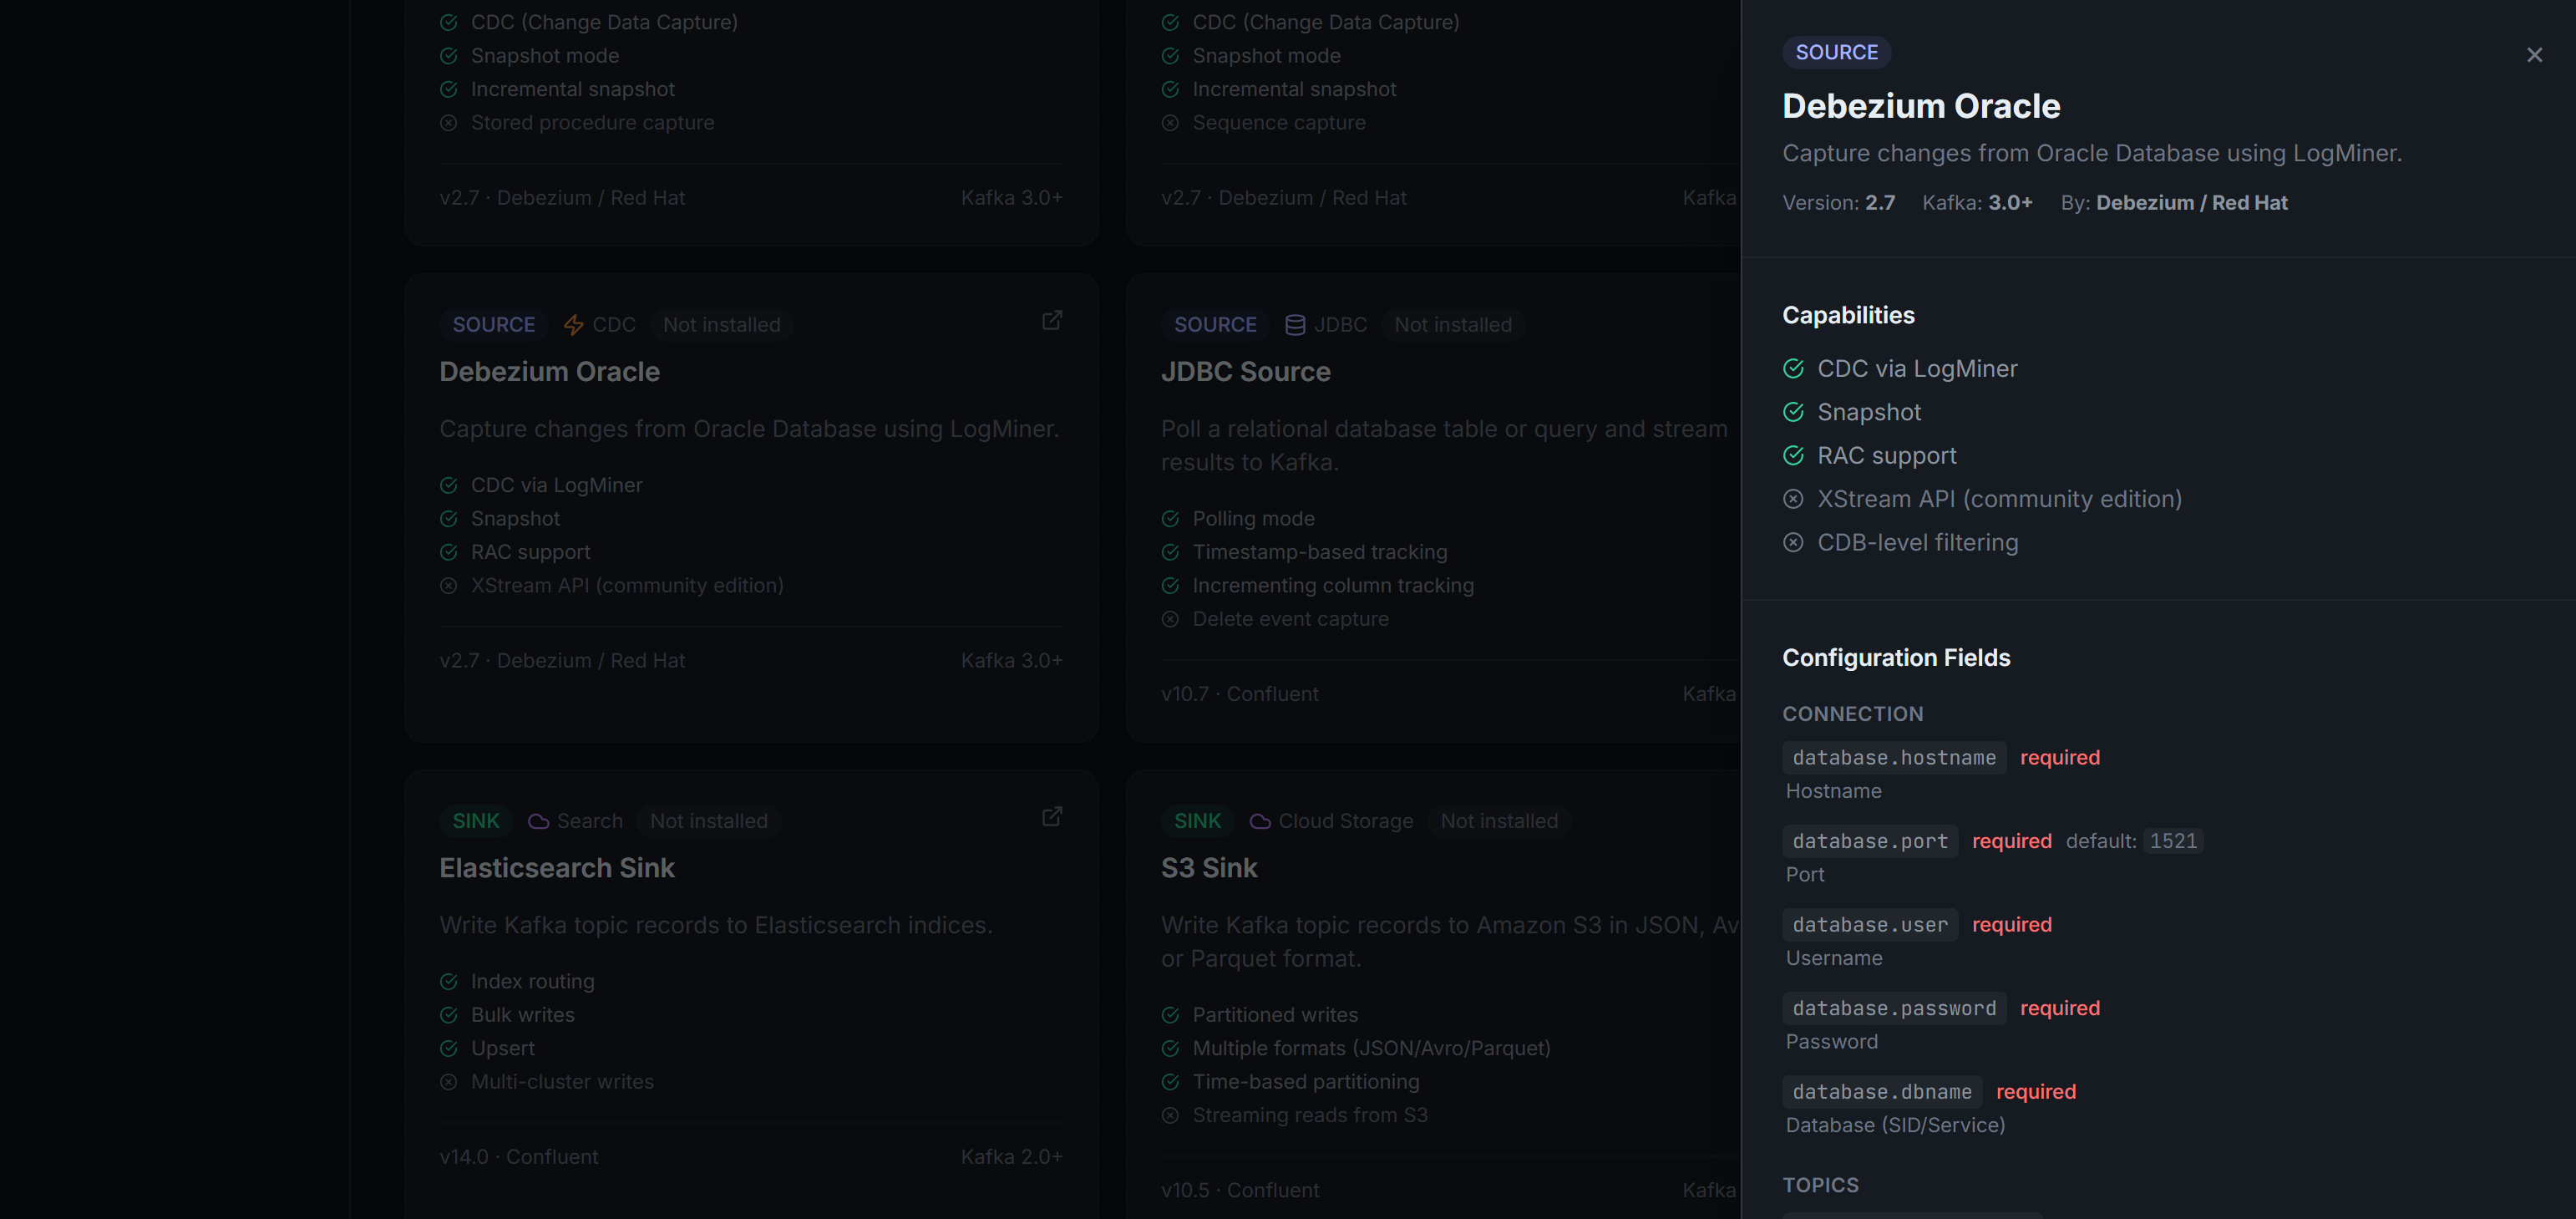
Catalog 03
Connector Detail & Config Reference
Each connector shows capabilities (CDC via LogMiner, Snapshot, RAC support), required configuration fields with types and defaults, and compatible Kafka and connector versions.